 Data Structure
 Networking
 RDBMS
RDBMS Operating System
 Java
Java MS Excel
 iOS
iOS HTML
HTML CSS
CSS Android
 Python
 C Programming
 C++
C++ C#
C# MongoDB
 MySQL
MySQL Javascript
 PHP
PHP
- Selected Reading
- UPSC IAS Exams Notes
- Developer's Best Practices
- Questions and Answers
- Effective Resume Writing
- HR Interview Questions
- Computer Glossary
- Who is Who
Pie chart in pygal
The Pygal library provides a powerful and intuitive way to create visually appealing pie charts in Python. Pie charts are a popular choice for displaying data distribution, and Pygal makes it easy to generate interactive SVG charts with customizable settings. With Pygal's user-friendly interface, we can easily define data, customize colors, titles, labels, legends, and more.
Whether we're visualizing sales figures, survey results, or any other categorical data, Pygal's pie charts offer an effective and visually appealing solution. This article explores the creation of pie charts using Pygal, showcasing its versatility and flexibility in presenting data insights.
How to plot a Pie chart in Pygal?
Below are the steps that we will follow to plot a Pie chart in Pygal ?
-
Import the necessary module ?
Import the pygal module, which is a Python library for creating interactive SVG (Scalable Vector Graphics) charts.
-
Define the data for the pie chart ?
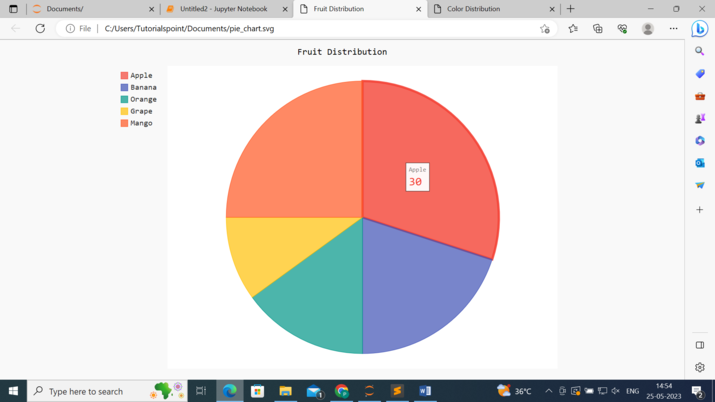
Defines a dictionary named data, which represents the data for the pie chart. Each key in the dictionary represents the name of a fruit, and its corresponding value represents the count or quantity of that fruit.
-
Create a pie chart object ?
Create an instance of the Pie class provided by Pygal, which represents a pie chart. This object will be used to configure and populate the chart.
-
Set the title of the pie chart ?
Set the title of the pie chart using the title attribute of the pie chart object.
-
Add data to the pie chart ?
Iterate over each item in the data dictionary using a loop. It retrieves the fruit name and count from each key-value pair and adds it to the pie chart object using the add() method. This step ensures that the data is added to the chart.
-
Render the chart ?
Finally, Call the render_to_file() method on the pie chart object to render the chart to an SVG (Scalable Vector Graphics) file. The file name is specified as "pie_chart.svg" in the below example.
Example
import pygal

# Data for the pie chart
data = {
   'Apple': 30,
   'Banana': 20,
   'Orange': 15,
   'Grape': 10,
   'Mango': 25
}

# Create a pie chart
pie_chart = pygal.Pie()
pie_chart.title = 'Fruit Distribution'

# Add data to the pie chart
for fruit, count in data.items():
   pie_chart.add(fruit, count)

# Render the chart to an SVG file
pie_chart.render_to_file('pie_chart.svg')
Output

Customize a Pygal pie chart
To customize a Pygal pie chart, we can make use of various settings and attributes provided by the library. Here are some common customization options that we can explore ?
-
Title and Labels ?
Set the title of the pie chart using the `title` attribute of the chart object.
Customize the labels of the pie slices using the `label_font_size` and `label_rotation` attributes.
Adjust the font size and font family of the chart's title using the `title_font_size` and `title_font_family` attributes.
-
Colors ?
Customize the colors of the pie slices using the `color` attribute. We can provide a list of color codes to be applied to the slices.
Adjust the color of the pie chart's background using the `background` attribute.
-
Legends ?
Show or hide the legend using the `show_legend` attribute.
Position the legend on different locations of the chart using the `legend_at_*` attributes. For example, `legend_at_bottom`, `legend_at_right`, etc.
Customize the legend's font size and font family using the `legend_font_size` and `legend_font_family` attributes.
-
Inner Radius ?
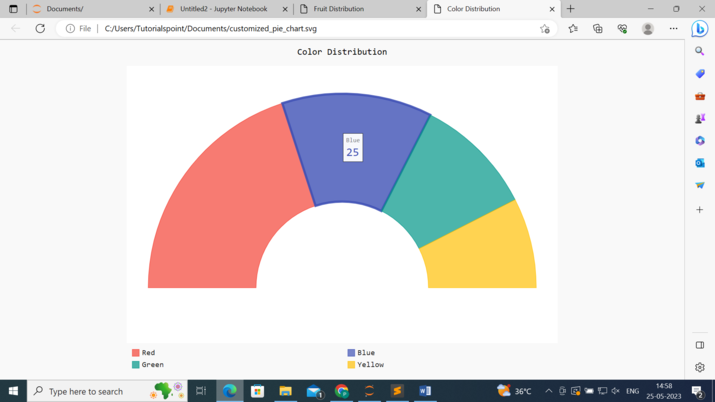
Adjust the inner radius of the pie chart using the `inner_radius` attribute. This allows you to create a donut-like appearance by setting a value of less than 1.
-
Explode ?
Make a specific slice "explode" outwards by using the `explosion` attribute. This gives emphasis to a particular slice in the chart.
-
Half-pie mode ?
Enable the half-pie mode using the `half_pie` attribute. This will display a half-circle pie chart instead of a full circle.
-
Tooltip ?
Enable tooltips to display additional information when hovering over the slices using the `tooltip_font_size` and `tooltip_font_family` attributes.
Below is the example of the pie chart in pygal with customizations ?
Example
import pygal

# Data for the pie chart
data = {
   'Red': 40,
   'Blue': 25,
   'Green': 20,
   'Yellow': 15
}

# Create a pie chart with customized settings
pie_chart = pygal.Pie(
   inner_radius=0.4,
   half_pie=True,
   show_legend=True,
   legend_at_bottom=True,
   title='Color Distribution',
   title_font_size=24,
   title_font_family='Arial',
   label_font_size=14,
   label_rotation=45,
   legend_font_size=16,
   legend_font_family='Verdana',
   colors=['#FF0000', '#0000FF', '#00FF00', '#FFFF00'],
   background='#EEEEEE',
   explosion={'Red': 0.1},
   tooltip_font_size=12,
   tooltip_font_family='Arial'
)

# Add data to the pie chart
for color, count in data.items():
   pie_chart.add(color, count)

# Render the chart to an SVG file
pie_chart.render_to_file('customized_pie_chart.svg')
Output

Conclusion
In conclusion, Pygal proves to be a valuable tool for creating pie charts in Python. It's simplicity and extensive customization options make it suitable for various data visualization needs.
With Pygal, we can effortlessly generate pie charts that effectively convey data distribution and engage viewers. Whether we're data analyst, business professional, or student, Pygal empowers you to present your data in a visually appealing and informative manner.

