
Article Categories
- All Categories
-
 Data Structure
-
 Networking
-
 RDBMS
RDBMS
-
 Operating System
-
 Java
Java
-
 MS Excel
-
 iOS
iOS
-
 HTML
HTML
-
 CSS
CSS
-
 Android
-
 Python
-
 C Programming
-
 C++
C++
-
 C#
C#
-
 MongoDB
-
 MySQL
MySQL
-
 Javascript
-
 PHP
PHP
-
 Economics & Finance
Explain how Pygal can be used to create interactive visualizations, and show how a bar graph can be visualized using Pygal.
Visualizing data is an important step since it helps understand what is going on in the data without actually looking at the complicated working underneath it and performing complicated computations.
Pygal is an open source Python package that helps in the creation of interactive plots, and SVG (Scalar Vector Graphics) images of graphs. SVG refers to dynamically generating animated graphs with the given data.
These SVG images of graphs can be used and customized depending on our requirements. The SVG images are highly scalable, hence they can be downloaded in high quality format. These downloaded images can also be embedded to various projects, websites and so on.
These interactive and customized graphs can be created with ease in Pygal. Pygal helps create bar chart, histogram, line plot, and much more.
Bar charts help represent data as horizontal or vertical rectangular bars. Pygal can be used to visualize different types of bar charts.
Pygal package can be installed using the below command on Windows −
pip install Pygal
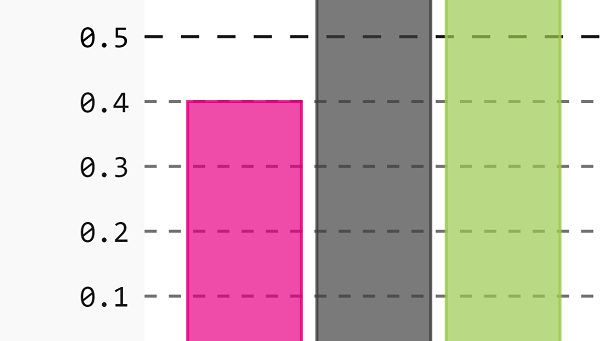
Let us understand how bar charts can be created using Pygal −
Example
import pygal
from pygal.style import Style
custom_style = Style(colors=('#E80080', '#404040', '#9BC850'))
bar_chart = pygal.Bar(height=400,width = 300,style=custom_style)

bar_chart.title = "Bar chart"
bar_chart.add("label 1", [0.4])
bar_chart.add("label 2", [1.2])
bar_chart.add("label 3", [1.5])
bar_chart.render_in_browser()
Output
Explanation
The required packages are imported into the environment.
The pygal.bar function is called with a few parameters.
This is assigned to a variable that is used to add characteristics.
The colors for the bar graphs are defined.
The height and width of the graph is also defined.
The title and values for the bar plots are defined.
The ‘render_in_browser’ function is called to plot the generated bar graph in the browser.

318 Views
