- Finding Percents and Percent Equations
- Home
- Finding a percentage of a whole number
- Finding a percentage of a whole number without a calculator: Basic
- Finding a percentage of a whole number without a calculator: Advanced
- Applying the percent equation: Problem type 1
- Applying the percent equation: Problem type 2
- Finding a percentage of a total amount: Real-world situations
- Finding a percentage of a total amount without a calculator: Sales tax, commission, discount
- Estimating a tip without a calculator
- Writing a ratio as a percentage without a calculator
- Finding the rate of a tax or commission
- Finding the total amount given the percentage of a partial amount
- Finding a percentage of a total amount in a circle graph
Finding a percentage of a total amount in a circle graph
Introduction
Circle graphs: A circle is divided into smaller portions. Each portion is represented as a percentage of the whole circle. A circle graph, or a pie chart, is used to visually represent information and data. It shows relative sizes of data.
Imagine you survey your friends to find the kind of ice cream they like best
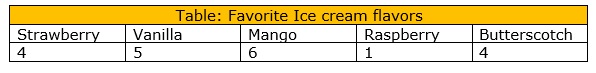
To make a circle graph form the data in the table above
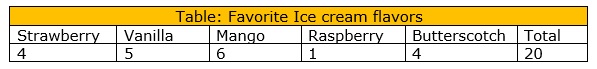
Step 1: Add up all the values in the table
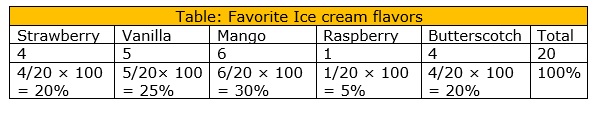
Step 2: Next divide each value by the total and multiply by 100 to get a percent
Step 3: You can show this data by using a Cicle graph as follows:
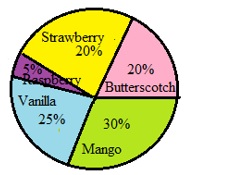
It is easy to see which ice cream flavors are most liked and which flavors are least liked, at a glance.
In this lesson, we solve problems involving finding percentages of a total amount in circle graphs.
Consider the following solved examples for a better understanding.
Example 1
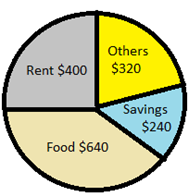
The following is a circle graph showing the monthly expenditure of Nathan. How much does he spend on food as a percentage?
Solution
Step 1:
Total expenditure = $400 + $320 + $240 + $640 = $1600
Step 2:
Expenditure on food = $640
Percentage of the expenditure on food = $\frac{640}{1600} \times 100 = 4\%$
Example 2
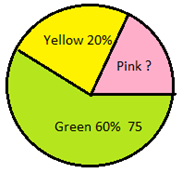
Some of the fifth graders were surveyed about their favorite color. The circle graph shows the results of the survey. What percent and how many students like the yellow color?
Solution
Step 1:
Percentage of Yellow
= 20%
Number of those who like green = 75
Step 2:
Percentage of those who like green = 60%
Number of those who like Yellow = $\frac{20}{60} \times 75 = 25$
Example 3
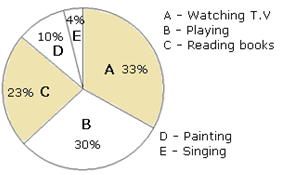
Mr. Nielsen asked students in his class how they spent their leisure time. The responses are as shown in the circle graph. If there are 40 students in the class how many students spent their leisure time in painting?
Solution
Step 1:
Number of students in the class = 40
The percentage of students who spent time in painting = 10%
Number of those who like green = 75
Step 2:
Number of students spending time in painting
= 10% of 40
$\frac{10}{100} \times 40 = 4$