- Excel Dashboards - Home
- Introduction
- Excel Features Create Dashboards
- Conditional Formatting
- Excel Charts
- Interactive Controls
- Advanced Excel Charts
- Excel PivotTables
- Power PivotTables & PivotCharts
- Power View Reports
- Key Performance Indicators
- Build a Dashboard
- Examples
Excel Dashboards - Power View Reports
Excel Power View enables interactive data visualization that encourages intuitive ad-hoc data exploration. The data visualizations are versatile and dynamic, thus facilitating ease of data display with a single Power View report.
You can handle large data sets spanning several thousands of rows on the fly switching from one visualization to another, drilling up and drilling down the data and displaying the essence of the data.
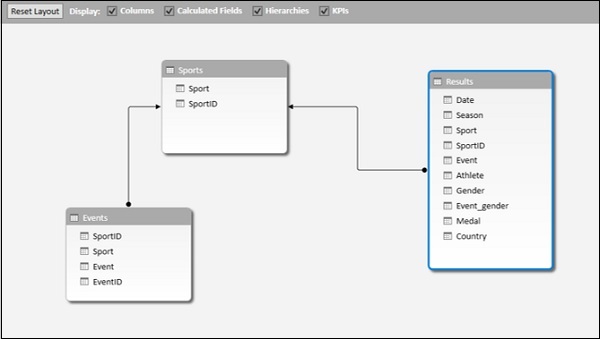
Power View reports are based the Data Model that can be termed as the Power View Database and that optimizes the memory enabling faster computations and displays of data. A typical Data Model will be as shown below.
In this chapter, you will understand the salient features of Power View reports that you can incorporate in your dashboard.
Power View Visualizations
Power View provides various types of data visualizations −
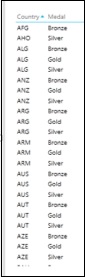
Table
Table visualization is the simplest and default visualization. If you want to create any other visualization, first table will be created that you need to convert to the required visualization by Switch Visualization options.
Matrix
Card
Charts
Power View has following chart types in visualizations −
- Line Chart
- Bar Chart
- Column Chart
- Scatter Chart
- Bubble Chart
- Pie Chart
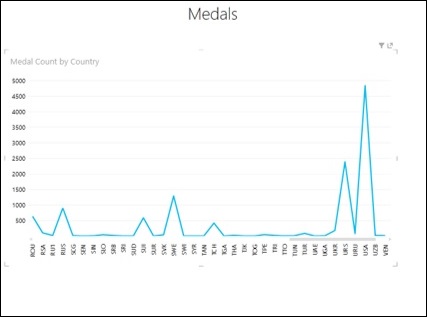
Line Chart
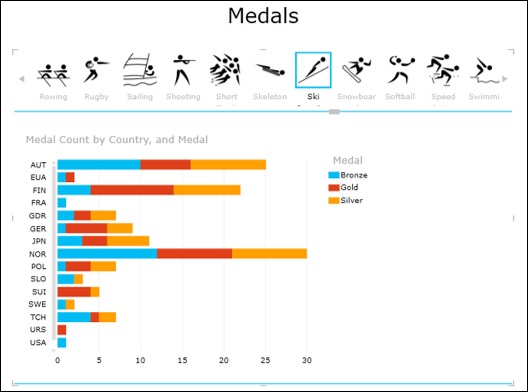
Bar Chart
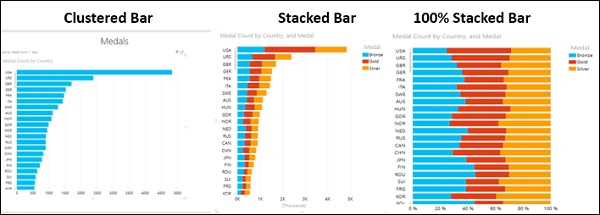
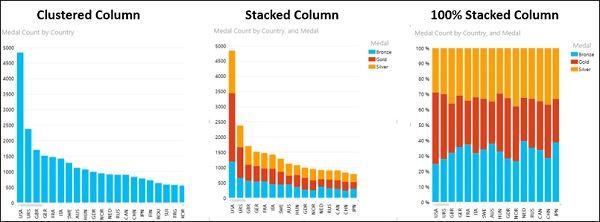
Column Chart
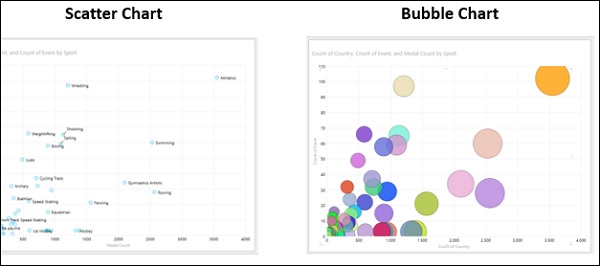
Scatter Chart and Bubble Chart
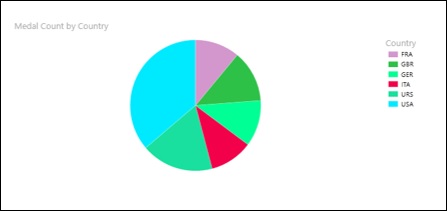
Pie Chart
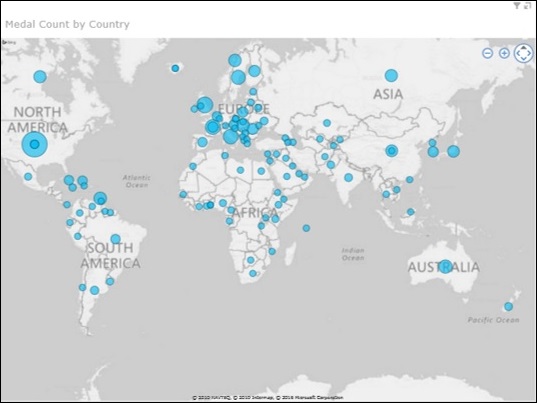
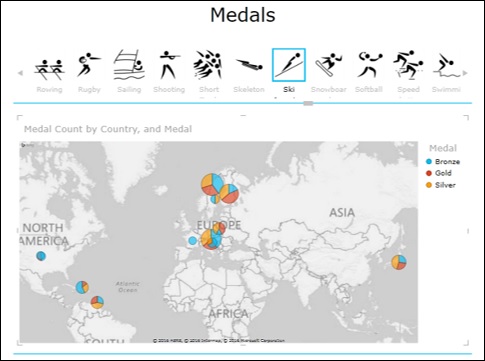
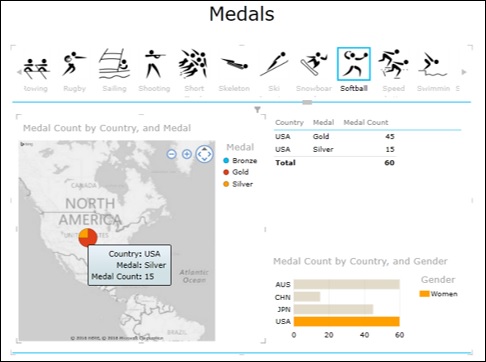
Map
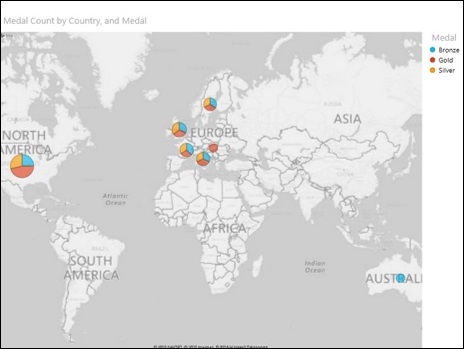
Map with Pie Charts
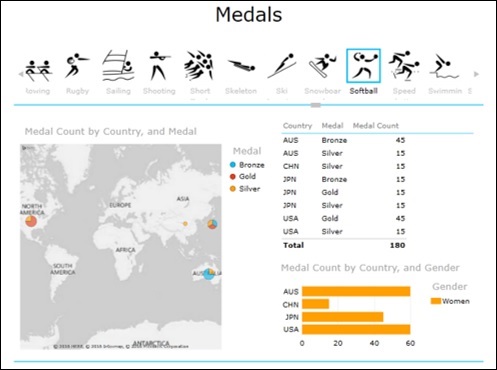
Combination of Power View Visualizations
Power View visualizations unlike Excel charts are powerful as they can be displayed as combination with each one depicting and/or highlighting significant results.
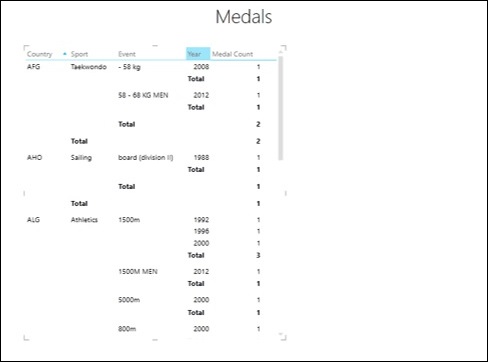
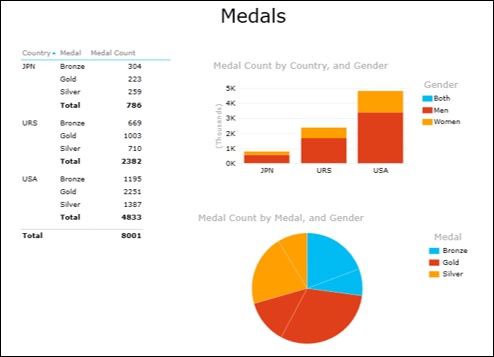
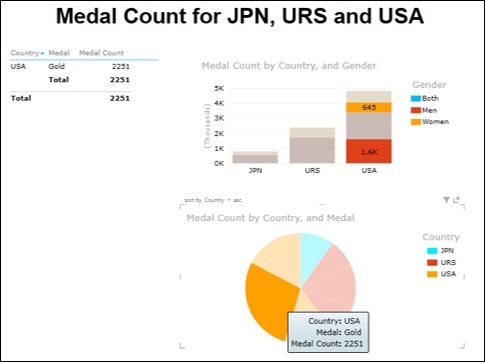
For example, you can have three visualizations in Power View −
Table visualization − displaying Country, Medal and Medal Count.
Stacked Column chart visualization − displaying Country, Gender and Medal Count.
Pie chart visualization − displaying Medal, Gender and Medal Count.
Interactive Nature of Charts in Power View Visualizations
Suppose you click on a Pie slice in the above Power View. You will observe the following −
The Pie slice that is clicked will be highlighted while the rest of the Pie slices will get dimmed.
The Table will display only the data corresponding to the highlighted slice.
The Clustered column will highlight the data corresponding to the highlighted slice and the rest of the chart will get dimmed.
This feature helps you to enable your audience viewing results from large data sets to explore the significant data points.
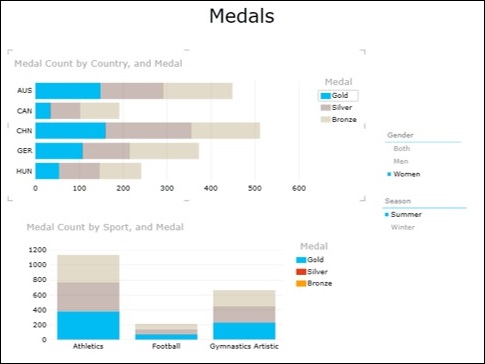
Slicers in Power View
You can use common Slicers in Power View to filter the data that is displayed by all the visualizations in Power View.
For example, in the following Power View, you have 2 visualizations −
Stacked Bar chart displaying Medal Count by Country and Medal.
Stacked Column chart displaying Medal Count by Sport and Medal.
Suppose you have two Slicers one for Gender and one for Season, the data in both the charts will get filtered to the selected fields in the Slicers.
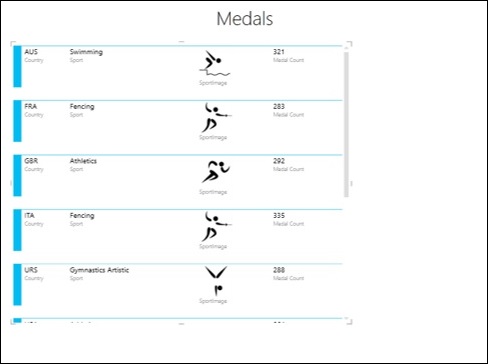
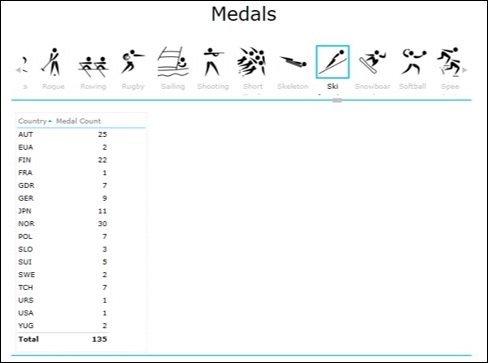
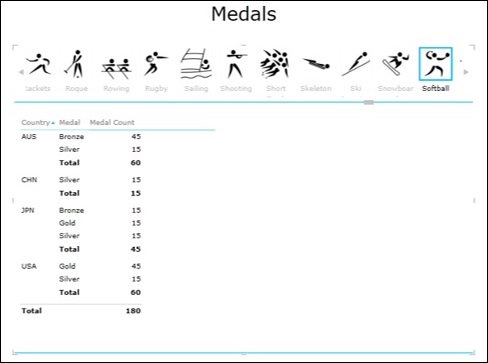
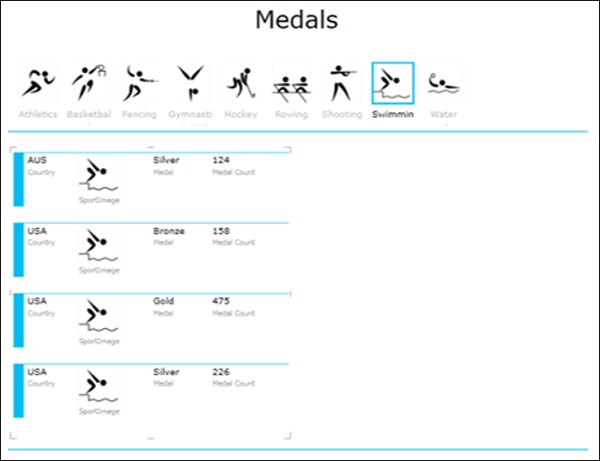
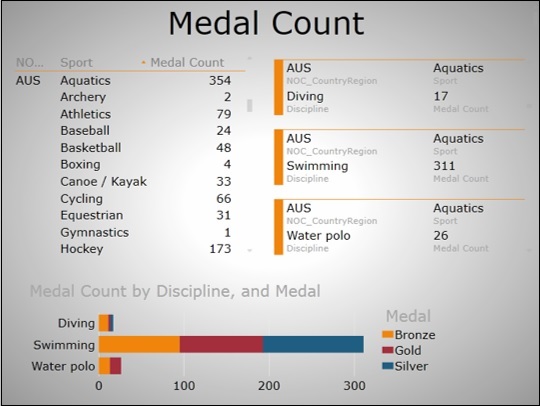
Tiles in Power View
In Power View, Tiles help you to pick one data point of a field and view the corresponding values. Tiles can be used in Table, Matrix, Card, Stacked Bar chart and Map visualizations.
Tiles in Table visualization
Tiles in Matrix visualization
Tiles in Card visualization
Tiles in Stacked Bar Chart visualization
Tiles in Map visualization
Tiles can be used with a combination of visualizations also.
You can use the interactive nature of the charts in such visualizations also.
Power View Reports
You can produce aesthetic Power View reports that you can include in your dashboard.
This could be done by choosing a suitable background, choosing the font, font size, color scales, etc.
