- Excel Dashboards - Home
- Introduction
- Excel Features Create Dashboards
- Conditional Formatting
- Excel Charts
- Interactive Controls
- Advanced Excel Charts
- Excel PivotTables
- Power PivotTables & PivotCharts
- Power View Reports
- Key Performance Indicators
- Build a Dashboard
- Examples
Excel Dashboards - Introduction
For those who are new to dashboards, it would be ideal to get an understanding of the dashboards first. In this chapter, you will get to know the definition of dashboard, how it got its name, how they became popular in IT, key metrics, benefits of dashboards, types of dashboards, dashboard data and formats and live data on dashboards.
In information technology, a dashboard is an easy to read, often single page, real-time user interface, showing a graphical presentation of the current status (snapshot) and historical trends of an organizations or departments key performance indicators to enable instantaneous and informed decisions to be made at a glance.
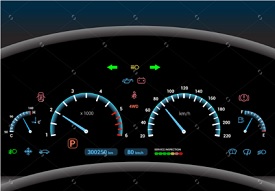
Dashboards take their name from automobile dashboards. Under the hood of your vehicle, there may be hundreds of processes that impact the performance of your vehicle. Your dashboard summarizes these events using visualizations so that you have the peace of mind to concentrate on safely operating your vehicle. In a similar way, business dashboards are used to view and/or monitor the organizations performance with ease.
The idea of digital dashboards emerged from the study of decision support systems in the 1970s. Business dashboards were first developed in the 1980s, but due to the problems with data refreshing and handling, they were put on the shelf. In the 1990s, the information age quickened pace and data warehousing, and online analytical processing (OLAP) allowed dashboards to function adequately. However, the use of dashboards did not become popular until the rise of key performance indicators (KPIs), and the introduction of Robert S. Kaplan and David P. Norton's Balanced Scorecard. Today, the use of dashboards forms an important part of decision making.
In todays business environment, the tendency is towards Big Data. Managing and extracting real value from all that data is the key for modern business success. A welldesigned dashboard is a remarkable information management tool.
Dashboard Definition
Stephen Few has defined a dashboard as a visual display of the most important information needed to achieve one or more objectives which fits entirely on a single computer screen so it can be monitored at a glance.
In the present terms, a dashboard can be defined as a data visualization tool that displays the current status of metrics and key performance indicators (KPIs) simplifying complex data sets to provide users with at a glance awareness of current performance.
Dashboards consolidate and arrange numbers and metrics on a single screen. They can be tailored for a specific role and display metrics of a department or an organization on the whole.
Dashboards can be static for a one-time view, or dynamic showing the consolidated results of the data changes behind the screen. They can also be made interactive to display the various segments of large data on a single screen.
Key Metrics for Dashboard
The core of the dashboard lies in the key metrics required for monitoring. Thus, based on whether the dashboard is for an organization on the whole or for a department such as sales, finance, human resources, production, etc. the key metrics that are required for display vary.
Further, the key metrics for a dashboard also depend on the role of the recipients (audience). For example, Executive (CEO, CIO, etc.), Operations Manager, Sales Head, Sales Manager, etc. This is due to the fact that the primary goal of a dashboard in to enable data visualization for decision making.
The success of a dashboard often depends on the metrics that were chosen for monitoring. For example, Key Performance Indicators, Balanced Scorecards and Sales Performance Figures could be the content appropriate in business dashboards.
Dashboard Benefits
Dashboards allow managers to monitor the contribution of the various departments in the organization. To monitor the organizations overall performance, dashboards allow you to capture and report specific data points from each of the departments in the organization, providing a snapshot of current performance and a comparison with earlier performance.
Benefits of dashboards include the following −
Visual presentation of performance measures.
Ability to identify and correct negative trends.
Measurement of efficiencies/inefficiencies.
Ability to generate detailed reports showing new trends.
Ability to make more informed decisions based on collected data.
Alignment of strategies and organizational goals.
Instant visibility of all systems in total.
Quick identification of data outliers and correlations.
Time saving with the comprehensive data visualization as compared to running multiple reports.
Types of Dashboards
Dashboards can be categorized based on their utility as follows −
- Strategic Dashboards
- Analytical Dashboards
- Operational Dashboards
- Informational Dashboards
Strategic Dashboards
Strategic dashboards support managers at any level in an organization for decision making. They provide the snapshot of data, displaying the health and opportunities of the business, focusing on the high level measures of performance and forecasts.
Strategic dashboards require to have periodic and static snapshots of data (e.g. daily, weekly, monthly, quarterly and annually). They need not be constantly changing from one moment to the next and require an update at the specified intervals of time.
They portray only the high level data not necessarily giving the details.
They can be interactive to facilitate comparisons and different views in case of large data sets at the click of a button. But, it is not necessary to provide more interactive features in these dashboards.
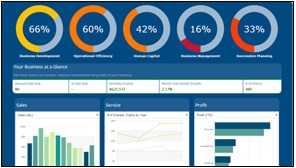
The following screenshot shows an example of an executive dashboard, displaying goals and progress.
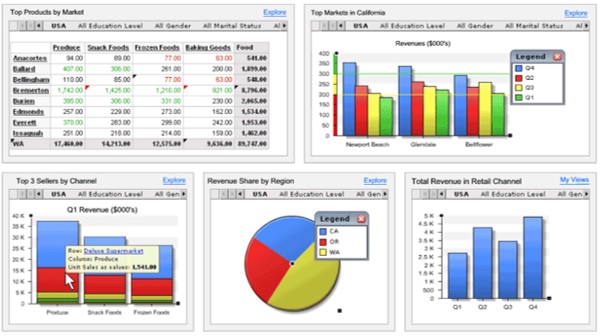
Analytical Dashboards
Analytical dashboards include more context, comparisons, and history. They focus on the various facets of data required for analysis.
Analytical dashboards typically support interactions with the data, such as drilling down into the underlying details and hence should be interactive.
Examples of analytical dashboards include Finance Management dashboard and Sales Management dashboard.
Operational Dashboards
Operational dashboards are for constant monitoring of operations. They are often designed differently from strategic or analytical dashboards and focus on monitoring of activities and events that are constantly changing and might require attention and response at a moment's notice. Thus, operational dashboards require live and up to date data available at all times and hence should be dynamic.
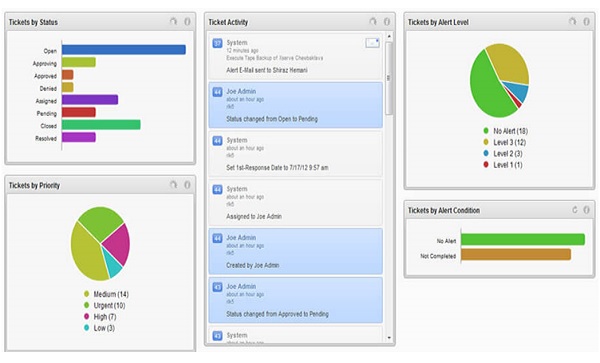
An example of an operation dashboard could be a support-system dashboard, displaying live data on service tickets that require an immediate action from the supervisor on high-priority tickets.
Informational Dashboards
Informational dashboards are just for displaying figures, facts and/or statistics. They can be either static or dynamic with live data but not interactive. For example, flights arrival/departure information dashboard in an airport.

Dashboard Data and Formats
The data required for a dashboard depends on its category. The premise for the data is that it should be relevant, error-free, up to date and live if required. The data can possibly be from various and different sources and formats (Spreadsheets, Text Files, Web Pages, Organizational Database, etc.).
The results displayed on a dashboard must be authentic, correct and apt. This is crucial since the information on a dashboard would lead to decisions, actions and/or inferences. Thus, along with the data being displayed, the medium chosen for the display is equally important as it should not give an erroneous impression in the data portrayal. The focus should be on the ability of the data visualization that would unambiguously project the conclusions.
Live Data on Dashboards
As discussed earlier in this chapter, data warehousing and online analytical processing (OLAP) is making it possible to refresh the dynamic dashboards instantly with live data. It is also making those who design the dashboards be independent of the organizations IT department for obtaining data.
Thus, the dashboards have become the most sought after medium from top management to a regular user.
