 Data Structure
 Networking
 RDBMS
RDBMS Operating System
 Java
Java MS Excel
 iOS
iOS HTML
HTML CSS
CSS Android
 Python
 C Programming
 C++
C++ C#
C# MongoDB
 MySQL
MySQL Javascript
 PHP
PHP
- Selected Reading
- UPSC IAS Exams Notes
- Developer's Best Practices
- Questions and Answers
- Effective Resume Writing
- HR Interview Questions
- Computer Glossary
- Who is Who
Implementing Real-Time Data Visualization with JavaScript and Charting Libraries
In today's data-driven world, the ability to visualise real-time data is crucial for businesses and developers alike. Real-time data visualisation allows us to gain insights, monitor trends, and make informed decisions based on up-to-date information. JavaScript, being a versatile and widely-used programming language, provides excellent tools and libraries for implementing real-time data visualisation.
In this article, we will explore how to leverage JavaScript and popular charting libraries to create dynamic and interactive data visualisations that update in real time.
Getting Started with JavaScript Charting Libraries
To kick off our real-time data visualisation journey, let's first choose a suitable charting library. There are several excellent options available, such as Chart.js, D3.js, and Plotly.js. For the purpose of this article, we will focus on Chart.js, a simple yet powerful library that offers a wide range of chart types and customization options.
Setting Up Chart.js
To begin, we need to include the Chart.js library in our project. We can do this by either downloading the library files or by using a package manager like npm or yarn. Once included, we can create a canvas element in our HTML file, which will serve as the container for our chart.
Example
Consider the code shown below.
<!DOCTYPE html>
<html>
<head>
   <title>Real-Time Data Visualization</title>
   <script src="https://cdn.jsdelivr.net/npm/chart.js"></script>
</head>
<body>
   <canvas id="chart"></canvas>
</body>
</html>
Explanation
In the script tag, we specify the source attribute (src) as the Chart.js CDN link. This link points to the latest version of Chart.js hosted on the jsDelivr CDN. jsDelivr is a popular and reliable CDN that hosts many JavaScript libraries and ensures fast and reliable delivery to your users.
By using the Chart.js CDN link, you don't need to download or host the Chart.js library files yourself. The browser will fetch the library directly from the CDN when the HTML page loads. This approach simplifies the setup process and ensures that you are always using the latest version of Chart.js.
Creating a Real-Time Line Chart
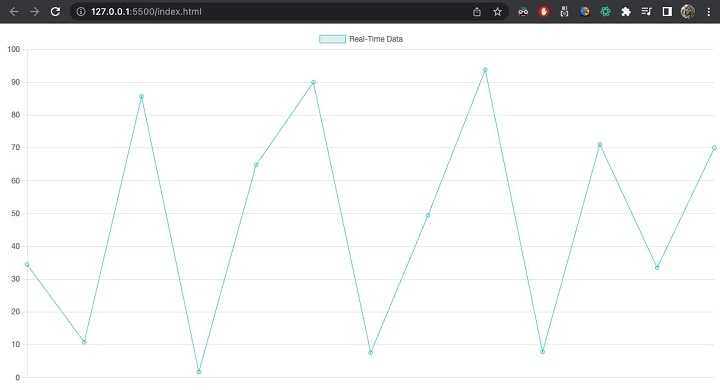
Let's start by creating a real-time line chart that updates dynamically as new data arrives. We will use JavaScript's setInterval() function to simulate data updates at regular intervals.
Example
Consider the code shown below.
const ctx = document.getElementById('chart').getContext('2d');

// Create an empty line chart
const chart = new Chart(ctx, {
   type: 'line',
   data: {
      labels: [],
      datasets: [{
         label: 'Real-Time Data',
         data: [],
         backgroundColor: 'rgba(75, 192, 192, 0.2)',
         borderColor: 'rgba(75, 192, 192, 1)',
         borderWidth: 1
      }]
   },
   options: {
      scales: {
         x: { display: false },
         y: { beginAtZero: true }
      }
   }
});

// Simulate real-time data updates
setInterval(() => {
   const timestamp = new Date().toLocaleTimeString();
   const data = Math.random() * 100; // Random data for demonstration

   // Update the chart
   chart.data.labels.push(timestamp);
   chart.data.datasets[0].data.push(data);
   chart.update();
}, 1000);
Explanation
In the above code, we create a new Chart instance and provide it with a canvas context. We configure the chart to display a line chart and initialize the data and options objects. The data object contains an empty array for labels (timestamps) and datasets (data points). We also define the appearance of the line chart using colors and border width.
To simulate real-time data updates, we use setInterval() to execute a function every second. Inside the function, we generate a timestamp and random data for demonstration purposes. We then push the timestamp and data to their respective arrays in the chart's data object and call the update() method to redraw the chart with the new data.
Output

Enhancing Interactivity with Real-Time Bar Chart
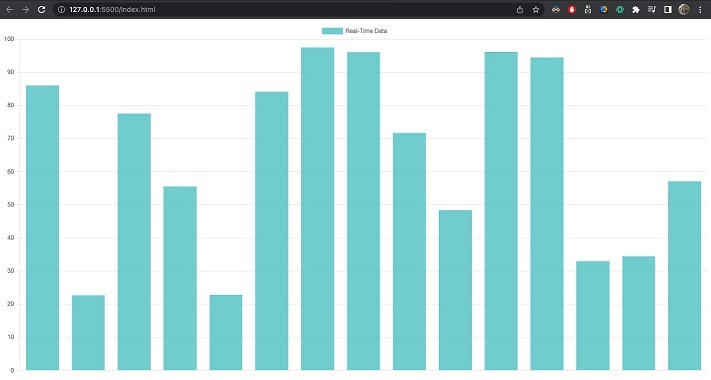
While line charts are effective for displaying trends, bar charts can provide a different perspective on real-time data. Let's explore how to create a real-time bar chart using Chart.js.
Example
Consider the code shown below.
const ctx = document.getElementById('chart').getContext('2d');

// Create an empty bar chart
const chart = new Chart(ctx, {
   type: 'bar',
   data: {
      labels: [],
      datasets: [{
         label: 'Real-Time Data',
         data: [],
         backgroundColor: 'rgba(75, 192, 192, 0.8)',
         borderColor: 'rgba(75, 192, 192, 1)',
         borderWidth: 1
      }]
   },
   options: {
      scales: {
         x: { display: false },
         y: { beginAtZero: true }
      }
   }
});

// Simulate real-time data updates
setInterval(() => {
   const category = `Category ${chart.data.labels.length + 1}`;
   const data = Math.random() * 100; // Random data for demonstration

   // Update the chart
   chart.data.labels.push(category);
   chart.data.datasets[0].data.push(data);
   chart.update();
}, 1000);
Explanation
The code above demonstrates how to create a real-time bar chart. The setup is similar to the line chart example, with the only difference being the chart type specified as 'bar' when creating the chart instance. We also adjust the colours and border width to match the bar chart style.
The data updates are simulated in the same way as before, with a new category label and random data generated in each iteration. The chart's data arrays are updated accordingly, and the chart is redrawn with the new data using the update() method.
Output

Conclusion
Real-time data visualisation is a powerful technique that enables developers to present data dynamically and engage users with up-to-date information. In this article, we explored how to implement real-time data visualisation using JavaScript and the Chart.js library. We created both line and bar charts that updated in real time, demonstrating the versatility and ease of use of JavaScript charting libraries.
By leveraging the provided code examples and customization options, developers can build their own real-time data visualisations tailored to their specific needs. JavaScript and charting libraries provide an excellent foundation for creating dynamic and interactive data-driven applications that enable better decision-making and analysis.

