 Data Structure
 Networking
 RDBMS
RDBMS Operating System
 Java
Java MS Excel
 iOS
iOS HTML
HTML CSS
CSS Android
 Python
 C Programming
 C++
C++ C#
C# MongoDB
 MySQL
MySQL Javascript
 PHP
PHP
- Selected Reading
- UPSC IAS Exams Notes
- Developer's Best Practices
- Questions and Answers
- Effective Resume Writing
- HR Interview Questions
- Computer Glossary
- Who is Who
Data Analysis and Visualization in Python?
Python provides numerous libraries for data analysis and visualization mainly numpy, pandas, matplotlib, seaborn etc. In this section, we are going to discuss pandas library for data analysis and visualization which is an open source library built on top of numpy.
It allows us to do fast analysis and data cleaning and preparation.Pandas also provides numerous built-in visualization feautures which we are going to see below.
Installation
To install pandas, run the below command in your terminal −
pipinstall pandas
Orwe have anaconda, you can use
condainstall pandas
Pandas-DataFrames
Data framesa re the main tools when we are working with pandas.
code −
import numpy as np
import pandas as pd
from numpy.random import randn
np.random.seed(50)
df = pd.DataFrame(randn(6,4), ['a','b','c','d','e','f'],['w','x','y','z'])
df
Output
| w |
x |
y |
z |
|
|---|---|---|---|---|
| a |
-1.560352 |
-0.030978 |
-0.620928 |
-1.464580 |
| b |
1.411946 |
-0.476732 |
-0.780469 |
1.070268 |
| c |
-1.282293 |
-1.327479 |
0.126338 |
0.862194 |
| d |
0.696737 |
-0.334565 |
-0.997526 |
1.598908 |
| e |
3.314075 |
0.987770 |
0.123866 |
0.742785 |
| f |
-0.393956 |
0.148116 |
-0.412234 |
-0.160715 |
Pandas-Missing Data
Weare going to see some convenient ways to deal with missing data inpandas, which automatically gets filled with zero's or nan.
import numpy as np
import pandas as pd
from numpy.random import randn
d = {'A': [1,2,np.nan], 'B': [9, np.nan, np.nan], 'C': [1,4,9]}
df = pd.DataFrame(d)
df
Output
|
|
A |
B |
C |
|---|---|---|---|
| 0 |
1.0 |
9.0 |
1 |
| 1 |
2.0 |
NaN |
4 |
| 2 |
NaN |
NaN |
9 |
So,we are having 3 missing value in above.
df.dropna()
|
|
A |
B |
C |
|---|---|---|---|
| 0 |
1.0 |
9.0 |
1 |
df.dropna(axis = 1)
|
|
C |
|---|---|
| 0 |
1 |
| 1 |
4 |
| 2 |
9 |
df.dropna(thresh = 2)
|
|
A |
B |
C |
|---|---|---|---|
| 0 |
1.0 |
9.0 |
1 |
| 1 |
2.0 |
NaN |
4 |
df.fillna(value = df.mean())
|
|
A |
B |
C |
|---|---|---|---|
| 0 |
1.0 |
9.0 |
1 |
| 1 |
2.0 |
9.0 |
4 |
| 2 |
1.5 |
9.0 |
9 |
Pandas − Import data
We are going to read the csv file which is either stored in our local machine(in my case) or we can directly fetch from the web.
#import pandas library
import pandas as pd

#Read csv file and assigned it to dataframe variable
df = pd.read_csv("SYB61_T03_Population Growth Rates in Urban areas and Capital cities.csv",encoding = "ISO-8859-1")

#Read first five element from the dataframe
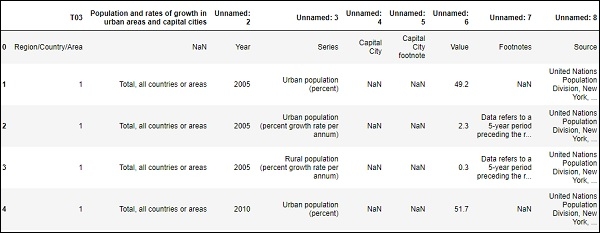
df.head()
Output

Toread the number of rows and columns in our dataframe or csv file.
#Countthe number of rows and columns in our dataframe.
df.shape
Output
(4166,9)
Pandas − Dataframe Math
Operationson dataframes can be done using various tools of pandas forstatistics
#To computes various summary statistics, excluding NaN values
df.describe()
Output

# computes numerical data ranks
df.rank()
Output

.....
.....

Pandas − plot graph
import matplotlib.pyplot as plt
years = [1981, 1991, 2001, 2011, 2016]

Average_populations = [716493000, 891910000, 1071374000, 1197658000, 1273986000]

plt.plot(years, Average_populations)
plt.title("Census of India: sample registration system")
plt.xlabel("Year")
plt.ylabel("Average_populations")
plt.show()
Output

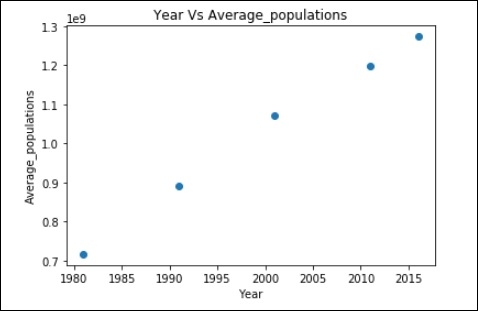
Scatter plot of above data:
plt.scatter(years,Average_populations)

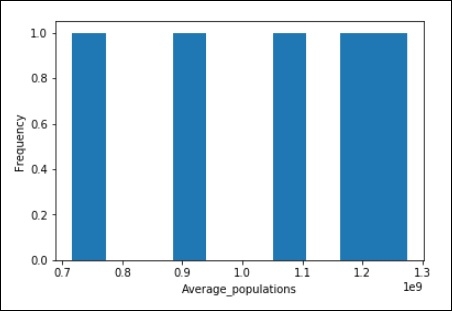
Histogram:
import matplotlib.pyplot as plt

Average_populations = [716493000, 891910000, 1071374000, 1197658000, 1273986000]

plt.hist(Average_populations, bins = 10)
plt.xlabel("Average_populations")
plt.ylabel("Frequency")

plt.show()
Output


