 Data Structure
 Networking
 RDBMS
RDBMS Operating System
 Java
Java MS Excel
 iOS
iOS HTML
HTML CSS
CSS Android
 Python
 C Programming
 C++
C++ C#
C# MongoDB
 MySQL
MySQL Javascript
 PHP
PHP
- Selected Reading
- UPSC IAS Exams Notes
- Developer's Best Practices
- Questions and Answers
- Effective Resume Writing
- HR Interview Questions
- Computer Glossary
- Who is Who
Python - Data visualization using Bokeh
Bokeh is an python data visualization library for web browsers. It czncreate elegant, concise construction of versatile graphics. It is used to quickly and easily make interactive plots, dashboards, and data applications. In this article we will see how we can create various types of basic graphs using Bokeh.
Plotting Lines
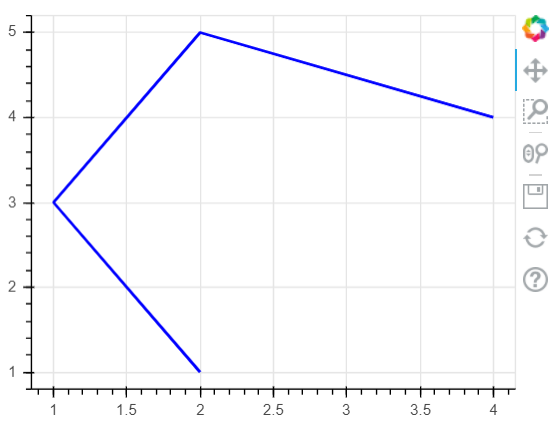
We can create a line plot by using the x and y coordinates of the points in it as two lists. We directly display the output in the browser by specifying the height and width of the figure. We can also supply additional parameters like width of the line and colour of the line.
Example
from bokeh.io import show
from bokeh.plotting import figure
p = figure(plot_width=300, plot_height=300)
# add a line renderer
p.line([ 2, 1, 2, 4], [ 1, 3, 5, 4],
      line_width=2, color="blue")
# show the results
show(p)
Output
Running the above code gives us the following result −

Plotting Circles
In this example we use the circle() function to supply the values for the x and y coordinates of the center of the circles in forms of lists. Again we can supply the colour and size of the circles as parameters to this function. We output the result to the browser window.
Example
from bokeh.io import show
from bokeh.plotting import figure
p = figure(plot_width=400, plot_height=300)
# add a line renderer
p.circle([ 2, 1.5, 2, 3,2.4], [ 2, 3, 4, 4,3],
         size = 10, color = "red", alpha = 0.8)
# show the results
show(p)
Output
Running the above code gives us the following result −

Plotting Bar Charts
Bar charts are plotted by using the vbar function. In the below example we take a list of values which are names of weekdays and then values for each bar as a list to the parameter named top. Of course with more elaborate programs we can import external data from files or APIs and supply those value to these parameters.
Example
from bokeh.io import show
from bokeh.plotting import figure
sales_qty = ['Mon', 'Tue', 'Wed', 'Thu', 'Fri']
# Set the x_range to the list of categories above
p = figure(x_range=sales_qty , plot_height=250, title="Sales Figures")
# Categorical values can also be used as coordinates
p.vbar(x=sales_qty , top=[6, 3, 4, 2, 4], width=0.4)
# Set some properties to make the plot look better
p.xgrid.grid_line_color = None
p.y_range.start = 0
show(p)
Output
Running the above code gives us the following result −


