
Article Categories
- All Categories
-
 Data Structure
-
 Networking
-
 RDBMS
RDBMS
-
 Operating System
-
 Java
Java
-
 MS Excel
-
 iOS
iOS
-
 HTML
HTML
-
 CSS
CSS
-
 Android
-
 Python
-
 C Programming
-
 C++
C++
-
 C#
C#
-
 MongoDB
-
 MySQL
MySQL
-
 Javascript
-
 PHP
PHP
-
 Economics & Finance
Kijun Line (Base Line) – Definition, Formula & Limitations
There are five components that make up the Ichimoku Cloud indication, with the Kijun Line being the most prominent. The Kijun Line, also known as the Base Line or Kijunsen, is one of these components. When the Kijun Line crosses the Conversion Line (Tenkan-sen), it is usually employed in combination with the Tenkan-sen to create trading signals when the lines cross.
The objective is to reflect central point of the highest and the lowest prices during the previous 26 periods of time.
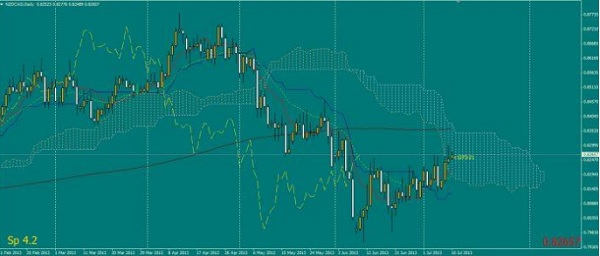
Example of Kijun Line
Key Points Briefly
When the price is above the Kijun Line, it suggests that the recent price movement has been on the positive side. When the price is below the Kijun Line, it indicates that recent price momentum has been on the down.
To produce trading signals, the Kijun Line and the Tenkan Line are utilized in conjunction with one another.
The Base Line is the pricing that has been in effect for the last 26 periods.
The Kijun Line is one of the five components of the Ichimoku indication, which has five other components as well.
The Kijun Line (Base Line) is calculated using the following formula −
$$\mathrm{Kijun \:Line(base\:line)=\frac{1}{2}\times\displaystyle(\max\limits_{{t..t-26}}[p]\:+\:\max\limits_{{t..t-26}}[p])}$$
Where:-
$$\mathrm{\displaystyle\max\limits_{{t..t-26}}[p] = maximum\: price \:for \:final \:26\: periods}$$
$$\mathrm{\displaystyle\max\limits_{{t..t-26}}[p] = minimum\: price\: for\: final \:26\: periods}$$
The Kijun Line and How to Calculate It (Base Line)
Find the price that has been reached the most often during the past 26 periods.
Find the price that has been the lowest throughout the past 26 periods.
Add the high and low values together, then divide by two.
After each period has ended, be sure to update the computation.
Kijun Line's Limitations
The Kijun Line will often appear close to the price of the asset, untill there is an extraordinarily strong trend. When the Kijun Line is often crossing or close to the price, it is less helpful for determining the direction of the trend as it formerly was.
Likewise, crossings with the Tenkan Line must be done with caution. Crossover signals may be very lucrative when the price is trending significantly in one direction. Many crossover signals, on the other hand, will be unprofitable if the price does not continue to trend after the crossing.
The Kijun Line is reactive in the sense that it reflects what the price has done in the previous period. The computation of the indicator does not have any predictive characteristics built into it.
As with the other components of the Ichimoku Cloud indicator, the Kijun Line should be utilized in combination with price movement and other technical indicators to provide the most accurate picture possible.

385 Views
