- Time Series - Home
- Time Series - Introduction
- Time Series - Programming Languages
- Time Series - Python Libraries
- Data Processing & Visualization
- Time Series - Modeling
- Time Series - Parameter Calibration
- Time Series - Naive Methods
- Time Series - Auto Regression
- Time Series - Moving Average
- Time Series - ARIMA
- Time Series - Variations of ARIMA
- Time Series - Exponential Smoothing
- Time Series - Walk Forward Validation
- Time Series - Prophet Model
- Time Series - LSTM Model
- Time Series - Error Metrics
- Time Series - Applications
- Time Series - Further Scope
- Time Series Useful Resources
- Time Series - Quick Guide
- Time Series - Useful Resources
- Time Series - Discussion
Time Series - Data Processing and Visualization
Time Series is a sequence of observations indexed in equi-spaced time intervals. Hence, the order and continuity should be maintained in any time series.
The dataset we will be using is a multi-variate time series having hourly data for approximately one year, for air quality in a significantly polluted Italian city. The dataset can be downloaded from the link given below − https://archive.ics.uci.edu/ml/datasets/air+quality.
It is necessary to make sure that −
The time series is equally spaced, and
There are no redundant values or gaps in it.
In case the time series is not continuous, we can upsample or downsample it.
Showing df.head()
In [122]:
import pandas
In [123]:
df = pandas.read_csv("AirQualityUCI.csv", sep = ";", decimal = ",")
df = df.iloc[ : , 0:14]
In [124]:
len(df)
Out[124]:
9471
In [125]:
df.head()
Out[125]:
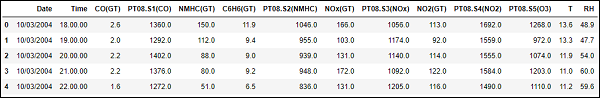
For preprocessing the time series, we make sure there are no NaN(NULL) values in the dataset; if there are, we can replace them with either 0 or average or preceding or succeeding values. Replacing is a preferred choice over dropping so that the continuity of the time series is maintained. However, in our dataset the last few values seem to be NULL and hence dropping will not affect the continuity.
Dropping NaN(Not-a-Number)
In [126]:
df.isna().sum()
Out[126]:
Date             114
Time             114
CO(GT)           114
PT08.S1(CO)      114
NMHC(GT)         114
C6H6(GT)         114
PT08.S2(NMHC)    114
NOx(GT)          114
PT08.S3(NOx)     114
NO2(GT)          114
PT08.S4(NO2)     114
PT08.S5(O3)      114
T                114
RH               114
dtype: int64
In [127]:
df = df[df['Date'].notnull()]
In [128]:
df.isna().sum()
Out[128]:
Date             0
Time             0
CO(GT)           0
PT08.S1(CO)      0
NMHC(GT)         0
C6H6(GT)         0
PT08.S2(NMHC)    0
NOx(GT)          0
PT08.S3(NOx)     0
NO2(GT)          0
PT08.S4(NO2)     0
PT08.S5(O3)      0
T                0
RH               0
dtype: int64
Time Series are usually plotted as line graphs against time. For that we will now combine the date and time column and convert it into a datetime object from strings. This can be accomplished using the datetime library.
Converting to datetime object
In [129]:
df['DateTime'] = (df.Date) + ' ' + (df.Time)
print (type(df.DateTime[0]))
<class 'str'>
In [130]:
import datetime

df.DateTime = df.DateTime.apply(lambda x: datetime.datetime.strptime(x, '%d/%m/%Y %H.%M.%S'))
print (type(df.DateTime[0]))
<class 'pandas._libs.tslibs.timestamps.Timestamp'>
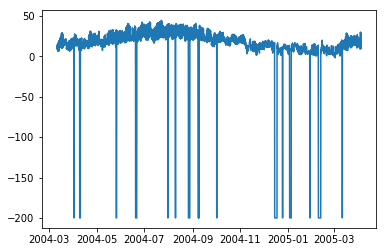
Let us see how some variables like temperature changes with change in time.
Showing plots
In [131]:
df.index = df.DateTime
In [132]:
import matplotlib.pyplot as plt
plt.plot(df['T'])
Out[132]:
[<matplotlib.lines.Line2D at 0x1eaad67f780>]
In [208]:
plt.plot(df['C6H6(GT)'])
Out[208]:
[<matplotlib.lines.Line2D at 0x1eaaeedff28>]
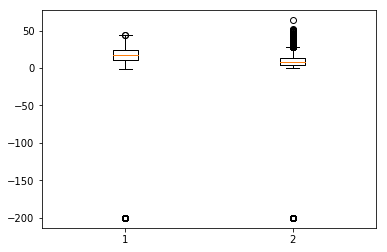
Box-plots are another useful kind of graphs that allow you to condense a lot of information about a dataset into a single graph. It shows the mean, 25% and 75% quartile and outliers of one or multiple variables. In the case when number of outliers is few and is very distant from the mean, we can eliminate the outliers by setting them to mean value or 75% quartile value.
Showing Boxplots
In [134]:
plt.boxplot(df[['T','C6H6(GT)']].values)
Out[134]:
{'whiskers': [<matplotlib.lines.Line2D at 0x1eaac16de80>,
   <matplotlib.lines.Line2D at 0x1eaac16d908>,
   <matplotlib.lines.Line2D at 0x1eaac177a58>,
   <matplotlib.lines.Line2D at 0x1eaac177cf8>],
   'caps': [<matplotlib.lines.Line2D at 0x1eaac16d2b0>,
   <matplotlib.lines.Line2D at 0x1eaac16d588>,
   <matplotlib.lines.Line2D at 0x1eaac1a69e8>,
   <matplotlib.lines.Line2D at 0x1eaac1a64a8>],
   'boxes': [<matplotlib.lines.Line2D at 0x1eaac16dc50>,
   <matplotlib.lines.Line2D at 0x1eaac1779b0>],
   'medians': [<matplotlib.lines.Line2D at 0x1eaac16d4a8>,
   <matplotlib.lines.Line2D at 0x1eaac1a6c50>],
   'fliers': [<matplotlib.lines.Line2D at 0x1eaac177dd8>,
   <matplotlib.lines.Line2D at 0x1eaac1a6c18>],'means': []
}