 Data Structure
 Networking
 RDBMS
RDBMS Operating System
 Java
Java MS Excel
 iOS
iOS HTML
HTML CSS
CSS Android
 Python
 C Programming
 C++
C++ C#
C# MongoDB
 MySQL
MySQL Javascript
 PHP
PHP
- Selected Reading
- UPSC IAS Exams Notes
- Developer's Best Practices
- Questions and Answers
- Effective Resume Writing
- HR Interview Questions
- Computer Glossary
- Who is Who
Show Uniform Discrete Distribution in Statistics using Python
In the field of statistics, there is a major role played by probability distributions in modeling and analyzing various random phenomena. Uniform Discrete Distribution is one of them. It is particularly used when dealing with discrete random variables which have equally likely outcomes. Ahead in this article, we will explore Uniform Discrete Distribution in the light of Python programming, using the scipy.stats.randint() function.
Scipy is a powerful python library for scientific analysis and calculations. The stats module provides tools for statistical analysis including probability distributions.
The randint() function in the scipy.stats module represents the uniform discrete variable, which inherits its functionalities from generic methods as an instance of the rv_discrete class. It allows handling of random discrete variables efficiently.
Parameters of randint() Function
The randint function takes in numerous parameters that control the behavior of the distribution. These parameters are
low (loc) It is the lower bound of the distribution, representing the smallest possible outcome. It is inclusive, i.e. it can be part of the distribution.
high (loc+scale) It is almost the opposite of low, the upper bound of the distribution representing the largest possible outcome. However it is exclusive, i.e. it is not a part of the distribution.
size (x) It is the no. of random variables to generate. Hence, determining the size of the output.
moments (mvsk) It is composed of 'm' = mean, 'v' = variance, 's' = Fisher's skew and 'k' = Fisher's kurtosis. Taking a default of mv it defines the statistical moments to calculate.
Creating a Uniform Discrete Random Variable
It is a simple implementation similar to other library modules. We need to import the scipy library first. Let us create a random variable that represents the six faces of a dice.
Example
import scipy.stats as stats
uniformDiscreteVariable = stats.randint(low=1, high=7)

#created a unique discrete variable that resembles six outcomes of a dice
print("UDR: \n",uniformDiscreteVariable)
Output
UDR:
   <scipy.stats._distn_infrastructure.rv_discrete_frozen object at 0x0000023787094040>
So we have created a uniform discrete integer variable with a lower bound of 1(inclusive) and upper bound of 7(exclusive), hence the range of possible outcomes is from 1 to 6.
Generating Uniform Discrete Values and Probability Distribution
Already we have defined our uniform discrete variables, now let us see how we can generate random values or variates from the same. Also let us generate the probability distribution.
The rvs(low, high, loc=0, size=1, random_state=None) method helps us generate random variates from our defined uniform discrete variable. For the probability distribution we will use the pmf(k, low, high, loc=0) method which gives the probability mass function, i.e. probability of each outcome of a random event. Below we have tried to print the generated uniform discrete variates and probability distribution.
Example
import scipy.stats as stats
uniformDiscreteVariable = stats.randint(low=1, high=7)
#created a unique discrete variable that resembles six outcomes of a dice

res = uniformDiscreteVariable.rvs(size=10)
#generating 10 random outputs i.e. dice rolls

probabDistrib = uniformDiscreteVariable.pmf(res)
print("UDR variates: ", res)
print("PD: ", probabDistrib)
Output
UDR variates:  [2 4 2 4 5]
PD:  [0.16666667 0.16666667 0.16666667 0.16666667 0.16666667]
Last time, we defined a uniform discrete random variable that fairly represents a dice of six outcomes. Using the rvs function here we have generated 10 random outputs from that same variable, i.e. the representation of outcome in 10 dice rolls. The probability function shows each number in dice has equal probability (1/6).
Visualizing Graphically
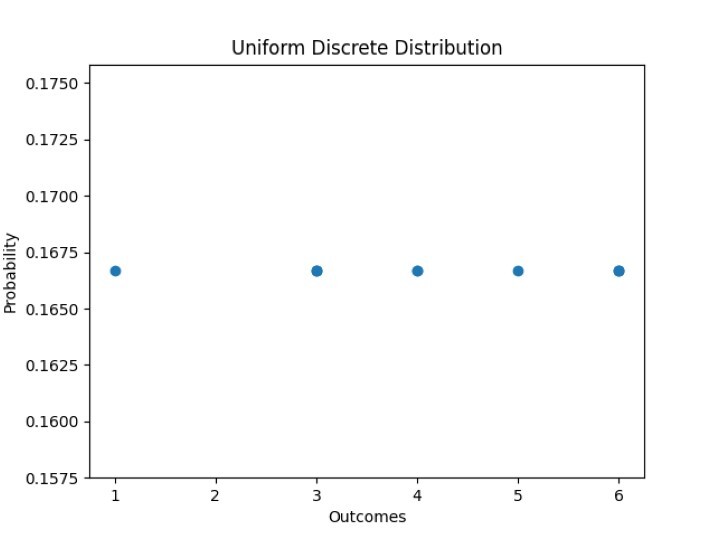
Now we have our random variates as well as the probability distribution, we can easily plot them in a graphical representation for a better visualization and understanding. In python, matplotlib.pyplot helps us in graphical representation of the data.
Example
import scipy.stats as stats
import matplotlib.pyplot as plt

uniformDiscreteVariable = stats.randint(low=1, high=7)
#created a unique discrete variable that resembles six outcomes of a dice

res = uniformDiscreteVariable.rvs(size=10)
#generating 10 random outputs i.e. dice rolls

probabDistrib = uniformDiscreteVariable.pmf(res)

print("UDR variates: ", res)
print("PD: ", probabDistrib)

# Scatter plot for tossing a dice
plt.scatter(res, probabDistrib)
plt.xlabel('Outcomes')
plt.ylabel('Probability')
plt.title('Uniform Discrete Distribution')
plt.show()
Output
UDR variates:  [3 3 6 1 4 6 3 5 6 4]
PD:  [0.16666667 0.16666667 0.16666667 0.16666667 0.16666667 0.16666667
   0.16666667 0.16666667 0.16666667 0.16666667]

Varying Positional Arguments
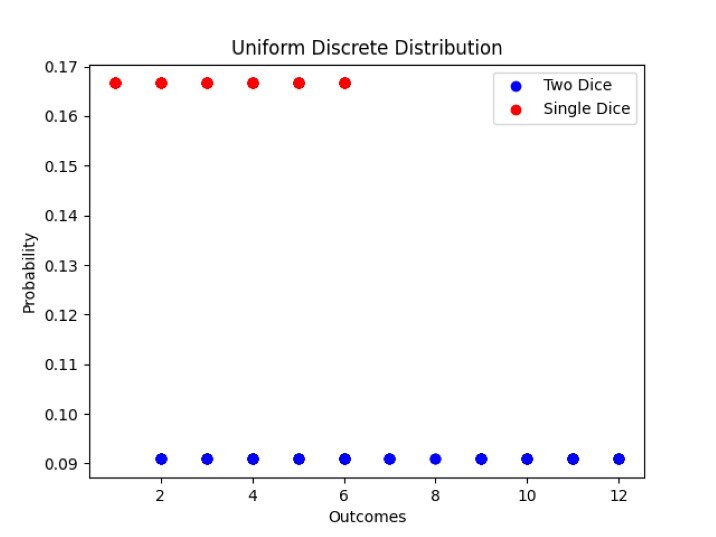
We can easily adjust the low and high parameters and other parameters to modify the uniform discrete distribution to fit various scenarios. So let us try generating the uniform discrete distribution for two dice thrown at random along with the single dice and visualize.
Example
import scipy.stats as stats
import matplotlib.pyplot as plt

uniformDiscreteVariable1 = stats.randint(low=2, high=13)
uniformDiscreteVariable2 = stats.randint(low=1, high=7)

# Generate random outcomes for two dice rolls
res1 = uniformDiscreteVariable1.rvs(size=100)
res2 = uniformDiscreteVariable2.rvs(size=100)

# Calculate probability distributions for the outcomes
probabDistrib1 = uniformDiscreteVariable1.pmf(res1)
probabDistrib2 = uniformDiscreteVariable2.pmf(res2)

print("UDR variates Two Dice: ", res1)
print("PD Two Dice: ", probabDistrib1)
print("UDR variates Single Dice: ", res2)
print("PD Single Dice: ", probabDistrib2)

# Scatter plot for tossing two dice
plt.scatter(res1, probabDistrib1, color='blue', label='Two Dice')

# Scatter plot for tossing a single dice
plt.scatter(res2, probabDistrib2, color='red', label='Single Dice')

plt.xlabel('Outcomes')
plt.ylabel('Probability')
plt.title('Uniform Discrete Distribution')
plt.legend()
plt.show()
Output
UDR variates Two Dice:  [ 5  3  5 10  2 11  2 12  4  9  4  9  6 10  8  5 11  9  2  8  9  3 12  6
 5 11  2  7  3 12  3 11  6  4  5  6  6  7 11 12  3 12  9  9  7 11 12 10
 9 10  2  6 11  6 10 10 11 10 12  6  6  4  5  6  4 10  9  7  8 10  6 11
 9  9  3  7  4 11  3 12  6  2  6 11  4 11  2  9  2  9  6  3  4 11  4  4
 7  6  5  6]
PD Two Dice:  [0.09090909 0.09090909 0.09090909 0.09090909 0.09090909 0.09090909
 0.09090909 0.09090909 0.09090909 0.09090909 0.09090909 0.09090909
 0.09090909 0.09090909 0.09090909 0.09090909 0.09090909 0.09090909
 0.09090909 0.09090909 0.09090909 0.09090909 0.09090909 0.09090909
 0.09090909 0.09090909 0.09090909 0.09090909 0.09090909 0.09090909
 0.09090909 0.09090909 0.09090909 0.09090909 0.09090909 0.09090909
 0.09090909 0.09090909 0.09090909 0.09090909 0.09090909 0.09090909
 0.09090909 0.09090909 0.09090909 0.09090909 0.09090909 0.09090909
 0.09090909 0.09090909 0.09090909 0.09090909 0.09090909 0.09090909
 0.09090909 0.09090909 0.09090909 0.09090909 0.09090909 0.09090909
 0.09090909 0.09090909 0.09090909 0.09090909 0.09090909 0.09090909
 0.09090909 0.09090909 0.09090909 0.09090909 0.09090909 0.09090909
 0.09090909 0.09090909 0.09090909 0.09090909 0.09090909 0.09090909
 0.09090909 0.09090909 0.09090909 0.09090909 0.09090909 0.09090909
 0.09090909 0.09090909 0.09090909 0.09090909 0.09090909 0.09090909
 0.09090909 0.09090909 0.09090909 0.09090909 0.09090909 0.09090909
 0.09090909 0.09090909 0.09090909 0.09090909]
UDR variates Single Dice:  [1 3 1 1 6 5 3 6 2 6 5 3 6 4 2 1 1 1 2 3 5 4 2 6 2 6 5 4 4 2 5 3 3 4 5 6 6
 6 1 5 2 1 5 3 5 2 3 4 1 4 6 2 2 6 3 2 3 1 6 5 2 1 2 6 5 6 4 5 4 6 2 2 6 5
 1 3 6 6 3 3 3 1 3 1 1 3 5 5 2 1 3 1 6 3 2 3 3 6 3 4]
PD Single Dice:  [0.16666667 0.16666667 0.16666667 0.16666667 0.16666667 0.16666667
 0.16666667 0.16666667 0.16666667 0.16666667 0.16666667 0.16666667
 0.16666667 0.16666667 0.16666667 0.16666667 0.16666667 0.16666667
 0.16666667 0.16666667 0.16666667 0.16666667 0.16666667 0.16666667
 0.16666667 0.16666667 0.16666667 0.16666667 0.16666667 0.16666667
 0.16666667 0.16666667 0.16666667 0.16666667 0.16666667 0.16666667
 0.16666667 0.16666667 0.16666667 0.16666667 0.16666667 0.16666667
 0.16666667 0.16666667 0.16666667 0.16666667 0.16666667 0.16666667
 0.16666667 0.16666667 0.16666667 0.16666667 0.16666667 0.16666667
 0.16666667 0.16666667 0.16666667 0.16666667 0.16666667 0.16666667
 0.16666667 0.16666667 0.16666667 0.16666667 0.16666667 0.16666667
 0.16666667 0.16666667 0.16666667 0.16666667 0.16666667 0.16666667
 0.16666667 0.16666667 0.16666667 0.16666667 0.16666667 0.16666667
 0.16666667 0.16666667 0.16666667 0.16666667 0.16666667 0.16666667
 0.16666667 0.16666667 0.16666667 0.16666667 0.16666667 0.16666667
 0.16666667 0.16666667 0.16666667 0.16666667 0.16666667 0.16666667
 0.16666667 0.16666667 0.16666667 0.16666667]

Conclusion
Coming to the end of this article, we have tried to visualize the uniform discrete distribution, a fundamental concept widely used in statistics, in Python. It is defined for situations with equally likely outcomes. Powerful tools in the form of scipy.stats module and randint() method in python help us in statistically establishing an understanding and implementation of the uniform discrete data.
By understanding its parameters and using correct formats, we can create, generate, and visualize the uniform discrete distribution with ease. Whether it's simulating fair dice rolls, generating random outcomes, or handling real-world data, the uniform discrete distribution proves to be a valuable and versatile tool in the fields of statistics, including probability theory, finance, and computer science.
