 Data Structure
 Networking
 RDBMS
RDBMS Operating System
 Java
Java MS Excel
 iOS
iOS HTML
HTML CSS
CSS Android
 Python
 C Programming
 C++
C++ C#
C# MongoDB
 MySQL
MySQL Javascript
 PHP
PHP
- Selected Reading
- UPSC IAS Exams Notes
- Developer's Best Practices
- Questions and Answers
- Effective Resume Writing
- HR Interview Questions
- Computer Glossary
- Who is Who
Show Normal Inverse Gaussian Distribution in Statistics using Python
In this article we will be discussing the Normal inverse Gaussian distribution and also discuss how to implement and show this distribution using Python.
Understanding the Problem
The Normal Inverse Gaussian distribution in statistics is the probability distribution which can be used in various fields like finance, risk management and statistical analysis. So we will discuss the logic behind this distribution to implement in Python.
Logic for The Above Problem
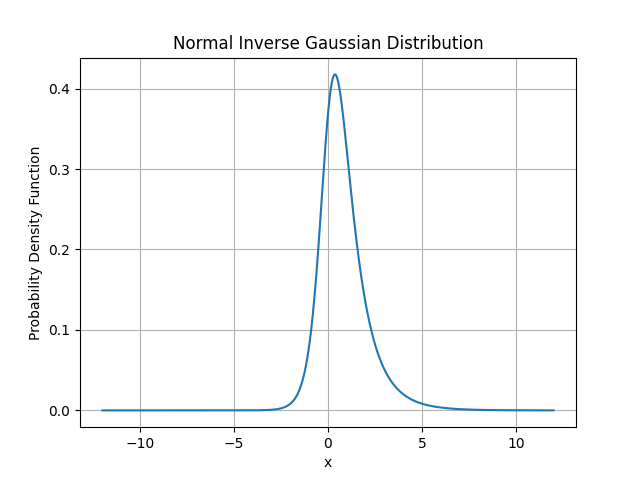
The normal-inverse Gaussian distribution (NIG), a continuous probability distribution, is characterized as the normal variance-mean mixture with the inverse Gaussian distribution as the mixing density. To plot and show the distribution we will use Python libraries like numpy, matplotlib and scipy.stats.
Algorithm
Step 1 First import the necessary libraries to show the Normal Inverse Gaussian distribution.
import numpy as nmp
import matplotlib.pyplot as mt_plt
from scipy.stats import norminvgauss
Step 2 Now we will set the parameters for Normal Inverse Gaussian distribution: alpha, beta, mu and delta.
alpha = 1.7
beta = 0.9
mu = 0
delta = 1.3
Step 3 After defining the parameters we will create a NIG distribution object as nig_distribution.
nig_distribution = norminvgauss(alpha, beta, loc=mu, scale=delta)
Step 4 Then we will generate the range of values for X.
x = nmp.linspace(-12, 12, 1000)
Step 5 Calculate the probability density function as pdf using pdf() method.
pdf = nig_distribution.pdf(x)
Step 6 Plot the probability density function to show using matplotlib library.
mt_plt.plot(x, pdf)
mt_plt.xlabel('x')
mt_plt.ylabel('Probability Density Function')
mt_plt.title('Normal Inverse Gaussian Distribution')
mt_plt.grid(True)
mt_plt.show()
Example
# Import the necessary libraries
import numpy as nmp
import matplotlib.pyplot as mt_plt
from scipy.stats import norminvgauss

alpha = 1.7
beta = 0.9
mu = 0
delta = 1.3

# Create an object for Normal Inverse Gaussian distribution
nig_distribution = norminvgauss(alpha, beta, loc=mu, scale=delta)

# create a range of values for x
x = nmp.linspace(-12, 12, 1000)

# Calculate the PDF for every x value
pdf = nig_distribution.pdf(x)

# Plot the PDF and show
mt_plt.plot(x, pdf)
mt_plt.xlabel('x')
mt_plt.ylabel('Probability Density Function')
mt_plt.title('Normal Inverse Gaussian Distribution')
mt_plt.grid(True)
mt_plt.show()
Output

Complexity
The time taken to calculate the PDF and show the NIG distribution is O(n), here n is the number of values in the range in our program the range is 1000. As we have generated the range of values for x which takes O(n) time and for calculating the PDF also takes O(n) time. So this is the reason for this time complexity.
Conclusion
In our article we have discussed Normal Inverse Gaussian distribution (NIG) and also shown the demonstration for the distribution. We have shown the logic and algorithm for this distribution and also calculated its time complexity. And Python libraries like numpy, matplotlib and scipy can be used to make the implementation easier in Python.

