 Data Structure
 Networking
 RDBMS
RDBMS Operating System
 Java
Java MS Excel
 iOS
iOS HTML
HTML CSS
CSS Android
 Python
 C Programming
 C++
C++ C#
C# MongoDB
 MySQL
MySQL Javascript
 PHP
PHP
- Selected Reading
- UPSC IAS Exams Notes
- Developer's Best Practices
- Questions and Answers
- Effective Resume Writing
- HR Interview Questions
- Computer Glossary
- Who is Who
Show Moyal Distribution in Statistics using Python
The problem is to show the moyal distribution in statistics with the help of Python. So we will use numpy and matplotlib libraries of Python to plot the statistics in this article. But first we need to understand what exactly moyal distribution is.
What is Moyal Distribution in Statistics?
The moyal distribution is a probability distribution, which is basically used in statistics to model the distribution of a set of random variables.
Understanding the Logic for the Problem
The problem at hand is to create a statistical model for the Moyal distribution with the help of Python libraries. In this article, the model will be generated using numpy and matplotlib libraries of Python. So first we will get two random numbers. And these random values will be summed up to get the moyal distribution. Suppose X and Y are the two random variables so the moyal distribution Z will be calculated as X + Y.
Algorithm
Step 1 First import the libraries called numpy as nmp and matplotlib as plot.
Step 2 Define the function to show the moyal distribution and name it as show_moyal_distribution. Inside the function we will pass two arguments as param and size.
Step 3 Inside the body of the created function we will get two sets of random numbers and give name as U1 and U2.
Step 4 And then calculate the X coordinate as A = -1 / param * nmp.log(U1) which shows the first term in the distribution formula.
Step 5 Next, calculate Y coordinate as B = -1 / param * nmp.log(U2) which shows the second term in the distribution.
Step 6 Then calculate the C as A - B which shows the random numbers to follow moyal distribution. and return the value of C.
Step 7 Define the parameters for the moyal distribution and call the function with the provided parameters to get the random numbers.
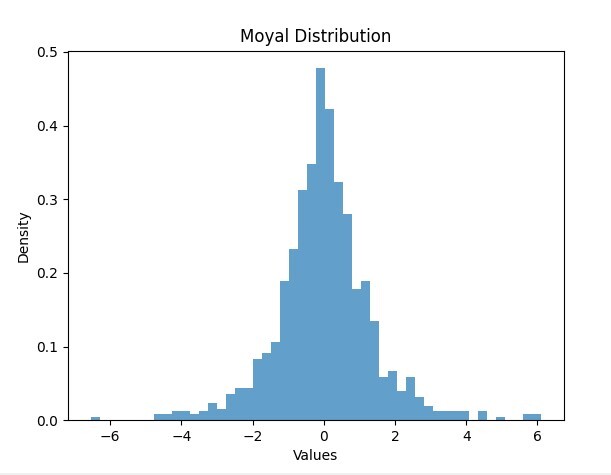
Step 8 Set the labels and title for plotting the histogram of the generated random numbers . And display the plot at the end.
Example
# Import the necessary library
import numpy as nmp
import matplotlib.pyplot as plot

# Define the function to show the moyal distribution
def show_moyal_distribution(param, size):
   U1 = nmp.random.rand(size)
   U2 = nmp.random.rand(size)

   A = -1 / param * nmp.log(U1)
   B = -1 / param * nmp.log(U2)

   C = A - B
   return C

# Usage
param = 1.0
size = 1000
rand_nums = show_moyal_distribution(param, size)

# Plot the Statistics
plot.hist(rand_nums, bins=50, density=True, alpha=0.7)
plot.xlabel('Values')
plot.ylabel('Density')
plot.title('Moyal Distribution')
plot.show()
Output

Conclusion
So we have seen the moyal distribution in the article. We have discussed the logic and algorithm to generate the moyal distribution statistics using Python. Basically this distribution is generated using the random numbers. So this is how we can generate various statistical distribution in Python.

