 Data Structure
 Networking
 RDBMS
RDBMS Operating System
 Java
Java MS Excel
 iOS
iOS HTML
HTML CSS
CSS Android
 Python
 C Programming
 C++
C++ C#
C# MongoDB
 MySQL
MySQL Javascript
 PHP
PHP
- Selected Reading
- UPSC IAS Exams Notes
- Developer's Best Practices
- Questions and Answers
- Effective Resume Writing
- HR Interview Questions
- Computer Glossary
- Who is Who
Show Nakagami Distribution in Statistics using Python
In the given problem statement we have to create an algorithm to show the Nakagami Distribution in Statistics with the help of Python and its libraries. So in this article we will use matplotlib, numpy and scipy libraries of Python to solve the given problem.
What is Nakagami Distribution in Statistics?
The Nakagami distribution is basically a probability distribution. It consists of parameters, a sample dataset and a model description for probability distribution. This distribution is mainly used in communication to model signals which reach the receiver with the help of several paths.
Understanding the Logic for the Problem
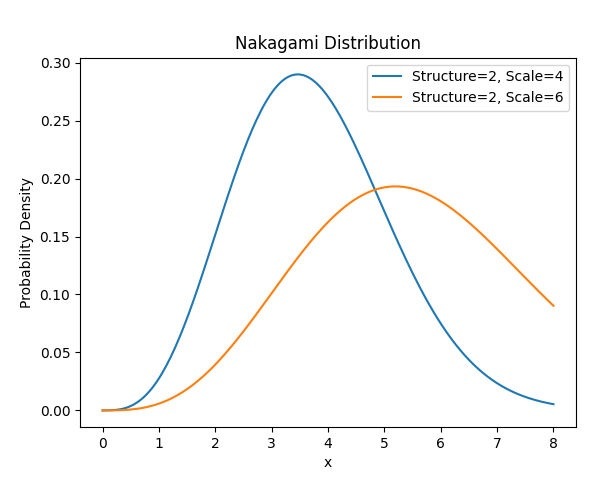
The problem at hand is to show the Nakagami Distribution using Python and its libraries. So we will first import all the necessary libraries and after importing we will generate the dataset on which we will create the Nakagami Distribution. Then we will calculate the probability density function and then with the help of the plot method we will plot the distribution.
Algorithm
Step 1 At first we will Import the necessary libraries
from scipy.stats import nakagami
import numpy as nmp
import matplotlib.pyplot as pplt
Step 2 Then we will generate the values of x
x = nmp.linspace(0, 8, 200)
Step 3 Next step is to define the parameters for Nakagami distribution
structure1, scale1 = 2, 4
structure2, scale2 = 2, 6
Step 4 After declaring the parameters we need to calculate the probability density function also called PDF values for every parameter. Here we will use Nakagami's pdf function to calculate the probability density function and pass the values of parameters in it.
prob_den_fun1 = nakagami.pdf(x, structure1, scale=scale1)
prob_den_fun2 = nakagami.pdf(x, structure2, scale=scale2)
Step 5 Now we will plot the probability density function with the help of the plot function of matplotlib library.
pplt.plot(x, prob_den_fun1, label='Structure={}, Scale={}'.format(structure1, scale1))
pplt.plot(x, prob_den_fun2, label='Structure={}, Scale={}'.format(structure2, scale2))
Step 6 After plotting the PDFs we will add labels to the plot and use the legend function of matplotlib which is used to describe the items in the graph.
pplt.xlabel('x')
pplt.ylabel('Probability Density')
pplt.title('Nakagami Distribution')
pplt.legend()
Step 7 At the end we will show the plot we have created using the show method of matplotlib.
pplt.show()
Example
from scipy.stats import nakagami
import numpy as nmp
import matplotlib.pyplot as pplt

x = nmp.linspace(0, 8, 200)

structure1, scale1 = 2, 4
structure2, scale2 = 2, 6

prob_den_fun1 = nakagami.pdf(x, structure1, scale=scale1)
prob_den_fun2 = nakagami.pdf(x, structure2, scale=scale2)

pplt.plot(x, prob_den_fun1, label='Structure={}, Scale={}'.format(structure1, scale1))
pplt.plot(x, prob_den_fun2, label='Structure={}, Scale={}'.format(structure2, scale2))

pplt.xlabel('x')
pplt.ylabel('Probability Density')
pplt.title('Nakagami Distribution')
pplt.legend()
pplt.show()
Output

Conclusion
As we have successfully created the code to demonstrate the usage of scipy.stats, matplotlib and numpy modules to show the Nakagami Distribution using the probability density function or PDF for different argument sets. We have provided the simple and efficient code having O(1) time complexity. In our code we can adjust the parameters as per our requirement and optimize the Nakagami Distribution and we can see how it reflects the shape and the curves. Overall the code provides a simple and effective process to show the Nakagami Distribution.

