 Data Structure
 Networking
 RDBMS
RDBMS Operating System
 Java
Java MS Excel
 iOS
iOS HTML
HTML CSS
CSS Android
 Python
 C Programming
 C++
C++ C#
C# MongoDB
 MySQL
MySQL Javascript
 PHP
PHP
- Selected Reading
- UPSC IAS Exams Notes
- Developer's Best Practices
- Questions and Answers
- Effective Resume Writing
- HR Interview Questions
- Computer Glossary
- Who is Who
Show Normal Distribution in Statistics using Python
In the problem statement we are required to show the normal distribution using Python and its libraries. In the tutorial we will discuss what is normal distribution and how it can be plotted using Python.
What is Normal Distribution in Statistics?
In the statistics, Normal Distribution is a popular probability distribution. It frequently serves as a model for naturally occurring occurrences and it has a bell-shaped curve as its different feature. It is also known as Gaussian distribution.
We can create random data points that fit the normal distribution using a random function in Python to display the ND. Following that, the histogram of the obtained data can be used to display the bell-shaped curve.

Logic for The Above Problem
To solve the given problem and to show the normal distribution using Python, we will use Python libraries like Numpy, Matplotlib and scipy.stats. These libraries will make our task easy and we will be able to show the normal distribution easily. We have to set the values of mean and standard deviation. And then calculate the probability density function and generate the coordinates of x and y. And using the matplotlib we will plot the histogram.
Algorithm
Step 1 First import the necessary libraries of Python. In our case we are importing Numpy, Matplotlib and Scipy libraries to demonstrate the normal distribution.
import numpy as nmp
import matplotlib.pyplot as mt_plt
from scipy.stats import norm
Step 2 Next, initiate the values for mean and standard deviation.
mean = 2
std_dev = 5
Step 3 Now we will generate the values for x-coordinate using linspace.
x = nmp.linspace(mean - 5 * std_dev, mean + 5 * std_dev, 1000)
Step 4 After getting the x-values we will generate the y coordinate values using probability density function for normal distribution.
y = norm.pdf(x, mean, std_dev)
Step 5 Now we will plot the bell shaped curve using the plot() function.
mt_plt.plot(x, y)
Step 6 And then we will plot the window and give the labels for the x and y axis. And also show the curve using the show() method.
# Plot the window and define the labels
mt_plt.xlabel('x')
mt_plt.ylabel('Probability Density')
mt_plt.title('Normal Distribution')

# Show the plot
mt_plt.show()
Example
import numpy as nmp
import matplotlib.pyplot as mt_plt
from scipy.stats import norm

# Set the values of mean and standard deviation
mean = 2
std_dev = 5

# Generate x-coordinate values
x = nmp.linspace(mean - 5 * std_dev, mean + 5 * std_dev, 1000)

# calculate the respective values of y with the help of PDF of ND
y = norm.pdf(x, mean, std_dev)

# Plot the bell-shaped curve
mt_plt.plot(x, y)

# Plot the window and define the labels
mt_plt.xlabel('x')
mt_plt.ylabel('Probability Density')
mt_plt.title('Normal Distribution')

# Show the plot
mt_plt.show()
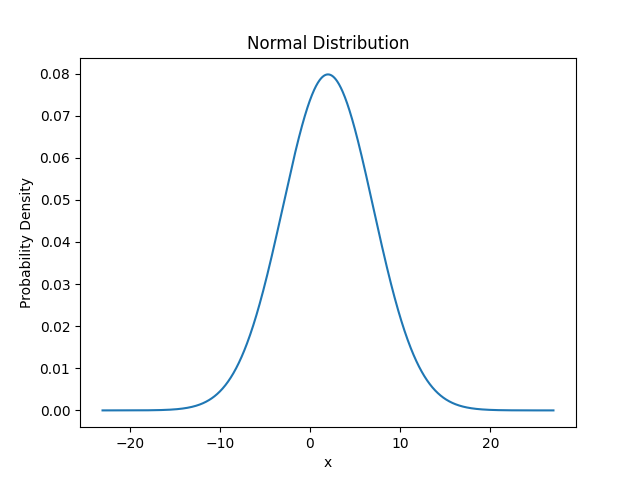
Output

Complexity
The time complexity for showing the normal distribution in Python is O(n), here n is the number of values in the range. As we have generated the range of values for x which takes O(n) time and for calculating the probability density function also takes O(n) time which is the main reason for this time complexity.
Conclusion
In our article we have discussed Normal distribution and also shown the demonstration for the distribution. We have created the logic and algorithm for showing the distribution in python using libraries and also calculated its time complexity.

