 Data Structure
 Networking
 RDBMS
RDBMS Operating System
 Java
Java MS Excel
 iOS
iOS HTML
HTML CSS
CSS Android
 Python
 C Programming
 C++
C++ C#
C# MongoDB
 MySQL
MySQL Javascript
 PHP
PHP
- Selected Reading
- UPSC IAS Exams Notes
- Developer's Best Practices
- Questions and Answers
- Effective Resume Writing
- HR Interview Questions
- Computer Glossary
- Who is Who
Show Non-Central Chi-squared Distribution in Statistics using Python
In the given problem statement we are required to show the Non-central Chi-squared distribution with the help of Python. So we will be using Python libraries to show the required result.
Understanding the Non-Central Chi-squared Distribution
The distribution called non-central chi-squared is a probability distribution in statistics. This distribution is mainly used in power analysis. It is a generalization of chi-squared distribution. It can be obtained by summing up the squares of standard normal random variables. In this the shape of the distribution is defined by the degrees of freedom. It incorporates a non-centrality parameter. This parameter shows the presence of a non-zero effect or signal when the data is being analyzed.
The non-central chi-squared distribution has mainly 2 parameters. First parameter is the degrees of freedom that is called 'df' and the non-centrality parameter is called 'nc'. Here degrees of freedom show the shape of the distribution and non-centrality parameters show the location or shift of the distribution. So by updating or manipulating these two values we create various scenarios.
The non-central chi-squared distribution can also be used in applications like signal processing and wireless communication.

Logic for The Above Problem
To show the non-central chi-squared distribution in Python we will be using the scipy.stats.ncx2() function, which represents a non-central chi-squared continuous random variable in Python. It inherits generic methods from rv_continous class. It also allows us for detailed analysis and computation related to this distribution.
Algorithm
Step 1 First import the necessary libraries of Python to show the Non-central Chi-squared distribution. In our program we are importing Numpy, Matplotlib and Scipy.stats libraries.
# Import the necessary libraries
import numpy as nmp
import matplotlib.pyplot as mt_plt
from scipy.stats import ncx2
Step 2 After importing the libraries we will be initiating the parameters of Non-central chi-squared distribution like degrees of freedom as df and non-centrality parameter as nc.
# Initiate the parameters of the distribution
df = 5
nc = 2
Step 3 Now we will be creating the Non-central chi-squared distribution object called dist. Its value will be calculated using the ncx2() function and pass both the above parameters in this function. And also generate the values for x-coordinate for plotting the distribution.
# Initiate a distribution object
dist = ncx2(df, nc)

# Generate x-values for plotting the distribution
x = nmp.linspace(0, 20, 100)
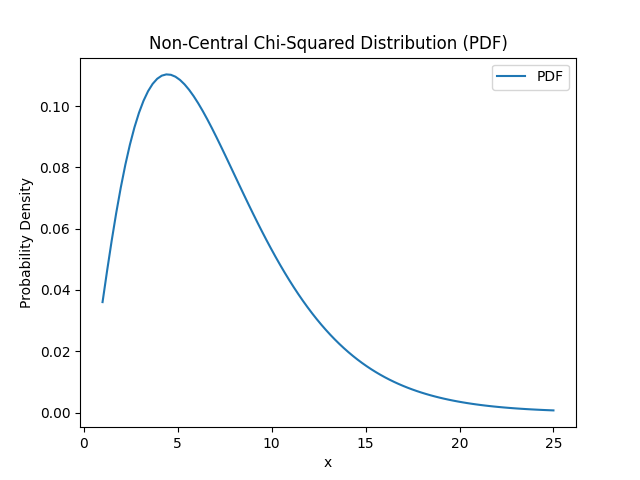
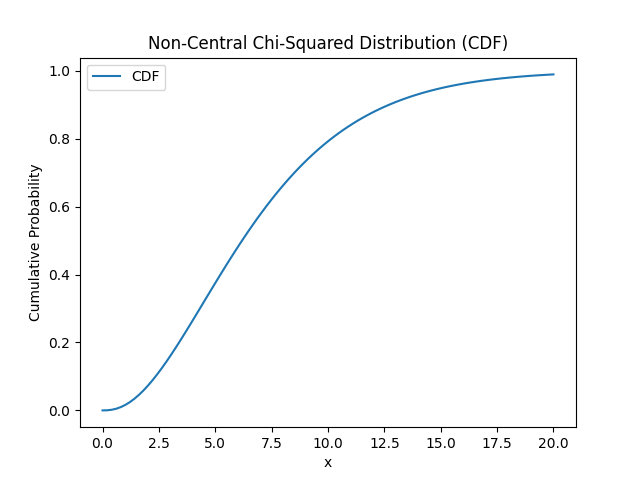
Step 4 Next, we will calculate the values of probability density function (pdf) and cumulative density function (cdf) using the dist() function.
# Calculate the values of PDF and CDF
pdf = dist.pdf(x)
cdf = dist.cdf(x)
Step 5 After calculating all the required values we will be plotting the probability density function using matplotlib.
# Plotting the Probability Density Function
mt_plt.figure()
mt_plt.title('Non-Central Chi-Squared Distribution (PDF)')
mt_plt.plot(x, pdf, label='PDF')
mt_plt.xlabel('x')
mt_plt.ylabel('Probability Density')
mt_plt.legend()
Step 6 Now we will also plot the cumulative density function using matplotlib library.
# Plot the Cumulative Density Function
mt_plt.figure()
mt_plt.title('Non-Central Chi-Squared Distribution (CDF)')
mt_plt.plot(x, cdf, label='CDF')
mt_plt.xlabel('x')
mt_plt.ylabel('Cumulative Probability')
mt_plt.legend()
Step 7 At the end we will show the plot using the show() function.
# Show the distribution
mt_plt.show()
Example
# Import the necessary libraries
import numpy as nmp
import matplotlib.pyplot as mt_plt
from scipy.stats import ncx2

# Initiate the parameters of the distribution
df = 5
nc = 2

# Initiate a distribution object
dist = ncx2(df, nc)

# Generate x-values for plotting the distribution
x = nmp.linspace(0, 20, 100)

# Calculate the values of PDF and CDF
pdf = dist.pdf(x)
cdf = dist.cdf(x)

# Plotting the Probability Density Function
mt_plt.figure()
mt_plt.title('Non-Central Chi-Squared Distribution (PDF)')
mt_plt.plot(x, pdf, label='PDF')
mt_plt.xlabel('x')
mt_plt.ylabel('Probability Density')
mt_plt.legend()

# Plot the Cumulative Density Function
mt_plt.figure()
mt_plt.title('Non-Central Chi-Squared Distribution (CDF)')
mt_plt.plot(x, cdf, label='CDF')
mt_plt.xlabel('x')
mt_plt.ylabel('Cumulative Probability')
mt_plt.legend()

# Show the distribution
mt_plt.show()
Output
$$\mathrm{Non-Central \: Chi-squared \: Distribution \: (CDF)}$$

Complexity
The time complexity for showing the Non-central chi-squared distribution is O(n), here n is the number of x-values. In our code the range for x-values is 100. As we have used the plot() method to plot the pdf and cdf which requires O(n) time to complete the task.
Conclusion
As we have successfully generated the Non-central chi-squared distribution using Python's numpy, matplotlib and scipy libraries. We have shown distribution for both probability density function (pdf) and cumulative density function (cdf). The non-central chi-squared distribution is a statistical distribution which uses the non-centrality parameters to show the deviation. So by manipulating the parameters we can create various scenarios to create distribution.

