 Data Structure
 Networking
 RDBMS
RDBMS Operating System
 Java
Java MS Excel
 iOS
iOS HTML
HTML CSS
CSS Android
 Python
 C Programming
 C++
C++ C#
C# MongoDB
 MySQL
MySQL Javascript
 PHP
PHP
- Selected Reading
- UPSC IAS Exams Notes
- Developer's Best Practices
- Questions and Answers
- Effective Resume Writing
- HR Interview Questions
- Computer Glossary
- Who is Who
Show Pearson type-3 Distribution in Statistics using Python
The Pearson Type-3 Distribution is a continuous probability distribution that is widely used in statistics. It has a skewed distribution. Three parameters determined the shape of distribution: location, scale, and shape. Discovering this type of distribution would enable statisticians to analyse their data more effectively and make more precise predictions.
We can use pearson3.rvs function to generate random numbers from the distribution, and calculate the pdf (probability density function) at a given point with the help of pearson3.pdf function.
Parameters of Pearson type-3 distribution
Shape parameter ? This parameter determines the spread through the probability density of the distribution. The maximum value should be 0. When this value is less than 0, the distribution is expansive.
Location parameter ? This parameter determines the location of the distribution map. It should be null.
Scale parameter ? This parameter determines the scale of the distribution map. The maximum value should be 0. When this value is less than 0, the distribution is extended.
Syntax
For generating random numbers from the distribution.
ran_num = pearson3.rvs(shape, loc, scale, size)
Method 1: Here we are calculating random numbers from the given distribution
Example 1
Generating 12 random numbers from the distribution.
from scipy.stats import pearson3

#parameters of the Pearson Type 3 distribution
shape = 2.7
loc = 1.0
scale = 0.7

# Generating random numbers from the distribution
ran_num = pearson3.rvs(shape, loc, scale, size=12)
# Print the numbers
print(ran_num)
Output
[1.78675698 1.2868774  0.79792263 1.73894349 1.06018355 0.90932737
 1.03330347 0.79210384 0.61598714 0.5778327  0.4899408  0.72123621]
In this example, first we have defined the three parameters (shape,loc,scale), then applied the pearson3.rvs function for generating 12 random numbers.
Example 2
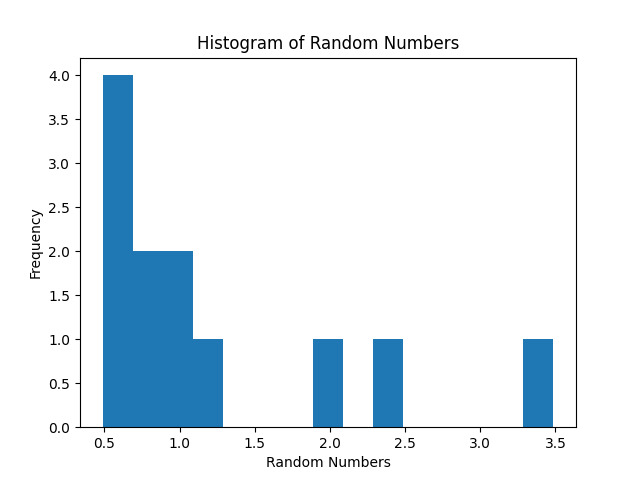
Generating and plotting histogram of 12 random numbers from the distribution.
from scipy.stats import pearson3
import matplotlib.pyplot as plt

#parameters of the Pearson Type 3 distribution
shape = 2.7
loc = 1.0
scale = 0.7

# Generating random numbers from the distribution
ran_num = pearson3.rvs(shape, loc, scale, size=12)

# histogram of the generated random numbers
plt.hist(ran_num, bins=15)  #bins define the number of bars
plt.xlabel('Random Numbers')
plt.ylabel('Frequency')
plt.title('Histogram of Random Numbers')
plt.show()
Output

In this example, first we have defined the three parameters (shape,loc,scale), then applied the pearson3.rvs function for generating 12 random numbers. In the end we have plotted the histogram graph for measuring those random numbers.
Example 3
Calculating mean and median of 12 random numbers from the distribution.
from scipy.stats import pearson3
import numpy as np

#parameters of the Pearson Type 3 distribution
shape = 2.7
loc = 1.0
scale = 0.7

# Generating random numbers from the distribution
ran_num = pearson3.rvs(shape, loc, scale, size=12)

# Calculating the mean and median of the generated random numbers
mean = np.mean(ran_num)
median = np.median(ran_num)

print("Mean:", mean)
print("Median:", median)
Output
Mean: 0.7719624059755859
Median: 0.6772205996213376
In this example, first we have defined the three parameters (shape,loc,scale), then applied the pearson3.rvs function for generating 12 random numbers, after this we are calculating mean and median value of 12 random numbers.
Method 2: Here we are calculating Probability Density Function from the given distribution
Syntax
For Calculating Probability Density Function from the distribution.
pdf = pearson3.pdf(value, shape, loc, scale)
Example 1
Calculating Probability Density Function (pdf) from the distribution on a specific point.
import numpy as np
import matplotlib.pyplot as plt
from scipy.stats import pearson3

# parameters of the Pearson Type III distribution
shape = 2.7
loc = 1.0
scale = 0.7

# Calculate the PDF of the distribution on specific point
value = 3.5
pdf = pearson3.pdf(value, shape, loc, scale)

print(pdf)
Output
0.015858643122817345
In this example, we have defined three parameters and given one specific value. Then applied the pearson3.pdf function for calculating the Probability Density Function.
Example 2
Calculating Probability Density Function (pdf) from the distribution with range 0 to 10.
import numpy as np
import matplotlib.pyplot as plt
from scipy.stats import pearson3

# parameters of the Pearson Type III distribution
shape = 2.7
loc = 1.0
scale = 0.7


# range of values
value = np.linspace(0, 10, 50)

# Calculate the PDF of the distribution
pdf = pearson3.pdf(value, shape, loc, scale)

print(pdf)
Output
[0.00000000e+00 0.00000000e+00 0.00000000e+00 1.38886232e+00
 7.32109657e-01 4.75891782e-01 3.31724610e-01 2.39563951e-01
 1.76760034e-01 1.32313927e-01 1.00074326e-01 7.62827095e-02
 5.85022291e-02 4.50857115e-02 3.48854378e-02 2.70832764e-02
 2.10857325e-02 1.64563072e-02 1.28704163e-02 1.00845296e-02
 7.91457807e-03 6.22057784e-03 4.89551703e-03 3.85722655e-03
 3.04237200e-03 2.40197479e-03 1.89804851e-03 1.50105698e-03
 1.18798272e-03 9.40852230e-04 7.45605438e-04 5.91225860e-04
 4.69069138e-04 3.72343273e-04 2.95705253e-04 2.34947290e-04
 1.86752271e-04 1.48502788e-04 1.18131774e-04 9.40054875e-05
 7.48317202e-05 5.95877020e-05 4.74634014e-05 3.78168933e-05
 3.01391876e-05 2.40264885e-05 1.91582965e-05 1.52801078e-05
 1.21897366e-05 9.72649439e-06]
In this example, we have defined three parameters and given value from range 0 to 10. Then applied the pearson3.pdf function for calculating the Probability Density Function and printed the result.
Example 3
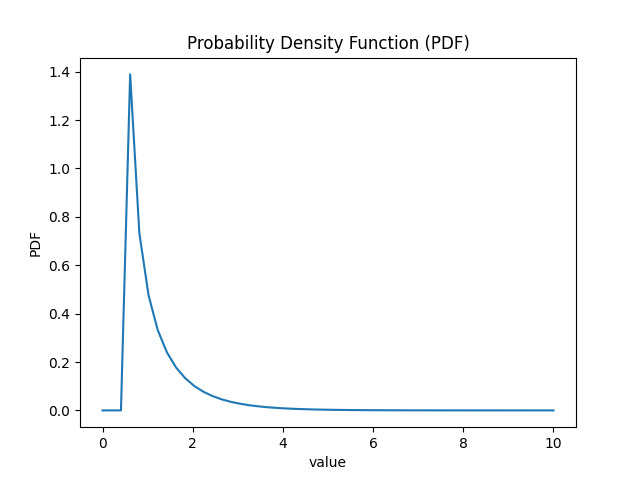
Visual representation of Probability Density Function (pdf) from the distribution.
import numpy as np
import matplotlib.pyplot as plt
from scipy.stats import pearson3

# parameters of the Pearson Type III distribution
shape = 2.7
loc = 1.0
scale = 0.7

# range of values
value = np.linspace(0, 10, 50)

# Calculate the PDF of the distribution
pdf = pearson3.pdf(value, shape, loc, scale)

# Plotting the PDF
plt.plot(value, pdf)
plt.xlabel('value')
plt.ylabel('PDF')
plt.title('Probability Density Function (PDF)')
plt.show()
Output

In this example, we can see the graphical representation of Probability Density Function.
Conclusion
In conclusion, The Pearson type-3 distribution is an important probability distribution. This analysis occupies an important place in probability theory and statistics.We can use various libraries and packages, such as SciPy, NumPy, and Pandas, to model the Pearson type-3 distribution in Python.

