 Data Structure
 Networking
 RDBMS
RDBMS Operating System
 Java
Java MS Excel
 iOS
iOS HTML
HTML CSS
CSS Android
 Python
 C Programming
 C++
C++ C#
C# MongoDB
 MySQL
MySQL Javascript
 PHP
PHP
- Selected Reading
- UPSC IAS Exams Notes
- Developer's Best Practices
- Questions and Answers
- Effective Resume Writing
- HR Interview Questions
- Computer Glossary
- Who is Who
How to plot 4D scatter-plot with custom colours and cutom area size in Python Matplotlib?
Introduction..
Scatter-plot are very useful when representing the data with two dimensions to verify whether there's any relationship between two variables. A scatter plot is chart where the data is represented as dots with X and Y values.
How to do it..
1. Install matplotlib by following command.
pip install matplotlib
2. Import matplotlib
import matplotlib.pyplot as plt
tennis_stats = (('Federer', 20),('Nadal', 20),('Djokovic', 17),('Sampras', 14),('Emerson', 12),('laver', 11),('Murray', 3),('Wawrinka', 3),('Zverev', 0),('Theim', 1),('Medvedev',0),('Tsitsipas', 0),('Dimitrov', 0),('Rublev', 0))
3. Next step is to prepare the data in any array format. We can also read the data from database or from a spreadsheets and format the data in below format.
titles = [title for player, title in tennis_stats]
players = [player for player, title in tennis_stats]
4. The parameters for .scatter, as with other methods of matplotlib, require an array of X and Y values.
*Note -* X and Y values both need to be the same size and also the data is by default converted into a float.
plt.scatter(titles, players)
<matplotlib.collections.PathCollection at 0x28df3684ac0>

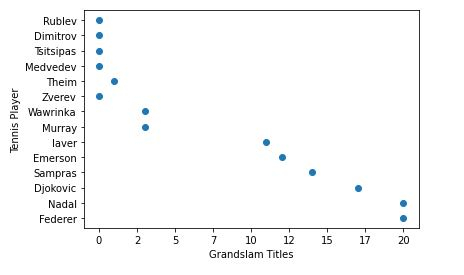
5. Ohh, my GrandSlam titles plotted on x-axis is a float. I will convert them to integer and also add a title for x-axis and y-axis in below function. The axis formatter will be overwritten with .set_major_formatter.
from matplotlib.ticker import FuncFormatter
def format_titles(title, pos):
return '{}'.format(int(title))

plt.gca().xaxis.set_major_formatter(FuncFormatter(format_titles))
plt.xlabel('Grandslam Titles')
plt.ylabel('Tennis Player')
plt.scatter(titles, players)

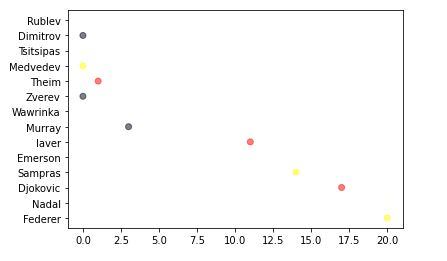
6. Do not think of scatter plots as just a 2D chart, a scatter plot can also add a third(area) and even a fourth dimension (color). Let me explain a bit what i will be doing below.
First we will define the colors of your choice and then loop them through randomly picking up the colors and assiging it tour values.
The alpha value makes each of the points semitransparent, allowing us to see where they overlap. The higher this value is, the less transparent the points will be.
import random

# define your own color scale.
random_colors = ['#FF0000', '#FFFF00', '#FFFFF0', '#FFFFFF', '#00000F']

# set the number of colors similar to our data values
color = [random.choice(random_colors) for _ in range(len(titles))]

plt.scatter(titles, players, c=color, alpha=0.5)
<matplotlib.collections.PathCollection at 0x28df2242d00>

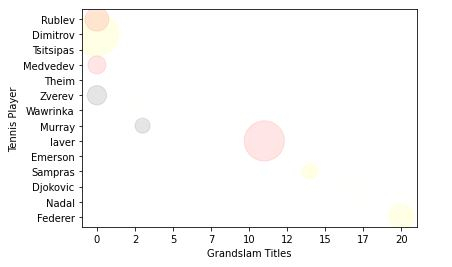
7. Now I, let us make the size/area of representation a bit larger.
import random

# define your own color scale.
random_colors = ['#FF0000', '#FFFF00', '#FFFFF0', '#FFFFFF', '#00000F']

# set the number of colors similar to our data values
color = [random.choice(random_colors) for _ in range(len(titles))]

# set the size
size = [(50 * random.random()) ** 2 for _ in range(len(titles))]

plt.gca().xaxis.set_major_formatter(FuncFormatter(format_titles))
plt.xlabel('Grandslam Titles')
plt.ylabel('Tennis Player')

plt.scatter(titles, players, c=color, s=size, alpha=0.1)
<matplotlib.collections.PathCollection at 0x28df22e2430>

Remember, the ultimate goal of a graph is to make data easy to understand.
I have shown the basics of what you can do with scatter plots. You can do more even more for instance, making the color dependent on the size to make all the points of the same size the same color, which may help us distinguish between the data.
Explore more - https://matplotlib.org/.
Finally, putting everything together.
Example
# imports
import matplotlib.pyplot as plt
import random

# preparing data..
tennis_stats = (('Federer', 20),('Nadal', 20),('Djokovic', 17),('Sampras', 14),('Emerson', 12),('laver', 11),('Murray', 3),('Wawrinka', 3),('Zverev', 0),('Theim', 1),('Medvedev',0),('Tsitsipas', 0),('Dimitrov', 0),('Rublev', 0))

titles = [title for player, title in tennis_stats]
players = [player for player, title in tennis_stats]

# custom function
from matplotlib.ticker import FuncFormatter
def format_titles(title, pos):
return '{}'.format(int(title))

# define your own color scale.
random_colors = ['#FF0000', '#FFFF00', '#FFFFF0', '#FFFFFF', '#00000F']

# set the number of colors similar to our data values
color = [random.choice(random_colors) for _ in range(len(titles))]

# set the size
size = [(50 * random.random()) ** 2 for _ in range(len(titles))]

plt.gca().xaxis.set_major_formatter(FuncFormatter(format_titles))
plt.xlabel('Grandslam Titles')
plt.ylabel('Tennis Player')

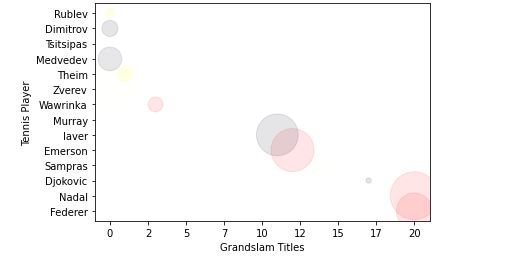
plt.scatter(titles, players, c=color, s=size, alpha=0.1)
<matplotlib.collections.PathCollection at 0x2aa7676b670>


