- Pycharm - Home
- Pycharm - Introduction
- Pycharm - Installation
- Pycharm - Understanding Basics
- Pycharm - Keymaps
- Pycharm - Shortcuts
- Pycharm - Omni
- Pycharm - Macros
- Pycharm - Micros
- Pycharm - Improving & Writing Code
- Pycharm - Console
- Pycharm - Interpreters
- Pycharm - Debugging & Breakpoints
- Pycharm - Integration of Version Control
- Pycharm - HTML & CSS Integration
- Pycharm - JavaScript Support
- Pycharm - Tips
- Pycharm - Database Tools
- Pycharm - Exporting Data
- Pycharm - Web Frameworks
- Pycharm - Django
- Pycharm - Pyramid
- Pycharm - Flask
PyCharm Resources
Pycharm - Debugging and Breakpoints
Running a python code comprises of two modes: running a script and debugging the script. This chapter focusses on debugging the Python script using PyCharm.
Steps Involved
The steps for debugging the Python project are as explained below −
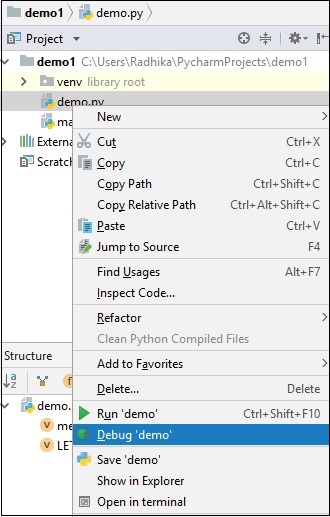
Step 1
Start with debugging the Python project as shown in the screenshot below −
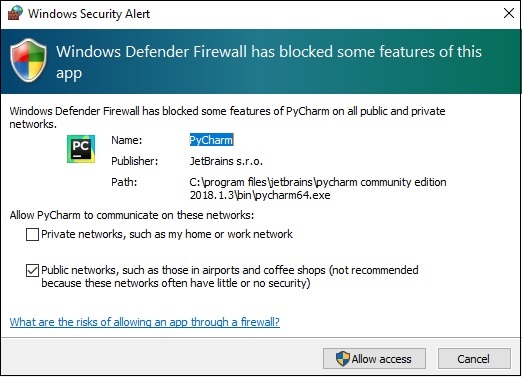
Step 2
Now, Windows firewall asks permission for debugging the Python project as the procedure involves line by line compilation.
Step 3
The debugging console is created in PyCharm editor as shown below which executes the output line by line.
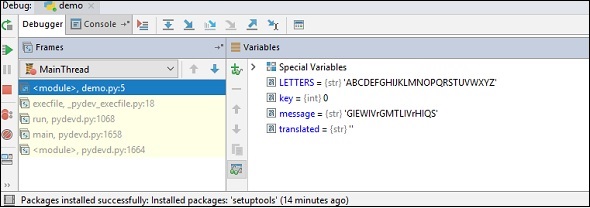
The run button moves from one line to another to execute the output as the way we want.
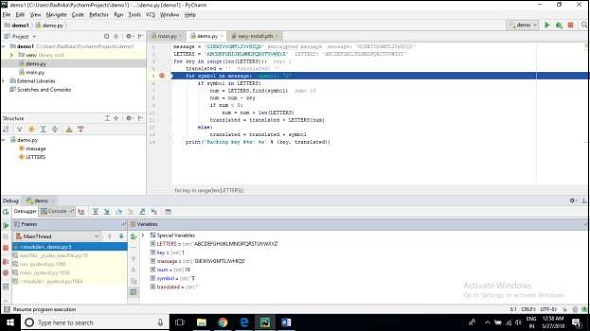
Understanding Breakpoints
While debugging a particular script, it is intentional to create a breakpoint. Breakpoints are intentional stopping place or the place where the code is paused in order to identify the output at specific stage.
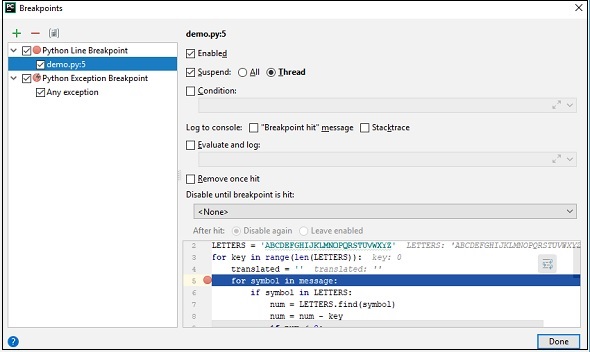
In PyCharm, breakpoints are visible using a separate dialog in the specified editor. It includes various attributes to evaluate the breakpoints defined and tracing log for the same with a main motive to achieve better programming practice.
