 Data Structure
 Networking
 RDBMS
RDBMS Operating System
 Java
Java MS Excel
 iOS
iOS HTML
HTML CSS
CSS Android
 Python
 C Programming
 C++
C++ C#
C# MongoDB
 MySQL
MySQL Javascript
 PHP
PHP
- Selected Reading
- UPSC IAS Exams Notes
- Developer's Best Practices
- Questions and Answers
- Effective Resume Writing
- HR Interview Questions
- Computer Glossary
- Who is Who
Plotting cross-spectral density in Python using Matplotlib
The utilization of Python for cross-spectral density analysis offers an effective means of comprehending the frequency characteristics and interconnections among signals. In this article, we delve into the process of plotting cross-spectral density using Python and Matplotlib. By harnessing the capabilities of these libraries, we gain the ability to visually represent the frequency spectrum and unveil relationships between signals.
Through a systematic approach, we illustrate the generation of random signals, computation of their cross-spectral density, and the creation of insightful visualizations.
What is cross-spectral density?
Cross-spectral density is a mathematical metric employed to examine the frequency characteristics and interconnections of two signals. It offers insights into the correspondence between the power of one signal at different frequencies and the power of another signal at those same frequencies.
Through the computation of cross-spectral density, one can detect the presence of shared or correlated frequency components between the signals, allowing for an assessment of their reciprocal influence or reliance. This analytical technique holds significant importance in diverse domains, such as signal processing, communication systems, and vibration analysis.
How to plot cross-spectral density in Python?
Below are the steps that we will follow to plot cross-spectral density in Python ?
We import the necessary libraries: numpy for numerical computations and matplotlib.pyplot for plotting.
We set the seed for the random number generator to ensure reproducibility.
We define the number of samples (N) and the time step (dt) for our signals. We also create a time vector t using the arange function from numpy.
We generate two signals ?
Signal 1 (x1) is a sine wave with a frequency of 5 Hz and an amplitude of 1.
Signal 2 (x2) is generated using numpy.random.normal function, which generates random samples from a normal (Gaussian) distribution with the specified mean and standard deviation. In this case, we use a mean of 0 and a standard deviation of 1 to generate white noise.
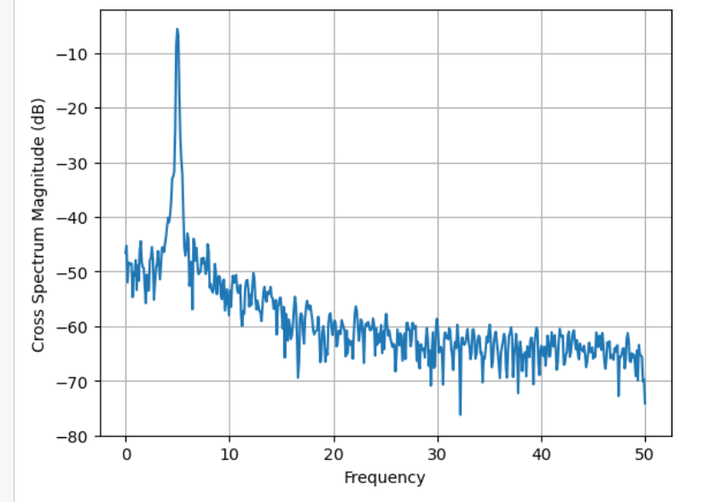
We compute the cross-spectral density using the plt.csd function from matplotlib.pyplot. This function takes the two signals (x1 and x2) as input, as well as the number of points used for the Fast Fourier Transform (FFT) computation (NFFT) and the sampling frequency (Fs).
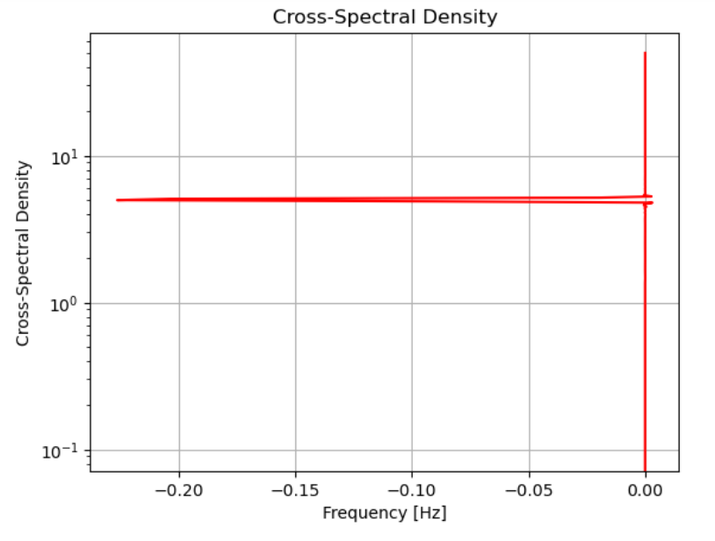
We plot the cross-spectral density using plt.semilogy, which plots the y-axis in logarithmic scale for better visualization. The frequency values (frequencies) and the absolute values of the cross-spectral density (np.abs(Cxy)) are passed as arguments to the plot function.
We add labels to the x-axis and y-axis using plt.xlabel and plt.ylabel, and set the title of the plot using plt.title.
We enable gridlines on the plot using plt.grid(True).
Finally, we display the plot using plt.show().
By modifying the generation of x1 and x2 signals, you can analyze the cross-spectral density between different types of signals or real-world data.
Below is the program example using the above steps, In this example, we generate two signals: a sine wave (x1) and white noise (x2). We then compute the cross-spectral density using the plt.csd function from Matplotlib. The NFFT parameter specifies the number of points used in each block for the FFT computation, and Fs represents the sampling frequency.
Example
import numpy as np
import matplotlib.pyplot as plt

# Generate two random signals
np.random.seed(0)
N = 1000  # Number of samples
dt = 0.01  # Time step
t = np.arange(0, N*dt, dt)  # Time vector

# Signal 1: Sine wave
f1 = 5  # Frequency of the sine wave
A1 = 1  # Amplitude of the sine wave
x1 = A1 * np.sin(2*np.pi*f1*t)

# Signal 2: White noise
mean = 0
std_dev = 1
x2 = np.random.normal(mean, std_dev, N)

# Compute the cross-spectral density
frequencies, Cxy = plt.csd(x1, x2, NFFT=1024, Fs=1/dt)

# Plot the cross-spectral density
plt.figure()
plt.semilogy(frequencies, np.abs(Cxy), 'r')
plt.xlabel('Frequency [Hz]')
plt.ylabel('Cross-Spectral Density')
plt.title('Cross-Spectral Density')
plt.grid(True)
plt.show()
Output


Conclusion
To conclude, Python and Matplotlib offer a valuable set of tools for plotting cross-spectral density, facilitating the analysis and visualization of signal frequency characteristics and interconnections. By following to the step-by-step guide presented in this article, professionals and researchers can effortlessly generate random signals, calculate their cross-spectral density, and produce meaningful visual representations.
This capability enables a profound comprehension of signal relationships, rendering it an essential asset across diverse fields such as signal processing, experimental data analysis, and scientific research.

