
Article Categories
- All Categories
-
 Data Structure
-
 Networking
-
 RDBMS
RDBMS
-
 Operating System
-
 Java
Java
-
 MS Excel
-
 iOS
iOS
-
 HTML
HTML
-
 CSS
CSS
-
 Android
-
 Python
-
 C Programming
-
 C++
C++
-
 C#
C#
-
 MongoDB
-
 MySQL
MySQL
-
 Javascript
-
 PHP
PHP
-
 Economics & Finance
What is Power Spectral Density & it's benefits?
A composite signal is composed of several frequency components. Each frequency component corresponds to a signal. Such signals of different frequencies put togetherforms a composite signal. Different signal frequencies present in the signal respond differently to the channel noise conditions. Power spectral density specifies the power levels of the frequency components present in a signal. It is denoted as PSD inshort. The PSD specifies the power of various frequencies present in the signal and we can determine the range of power over which the signal frequencies are operating at. Essentially, the PSD profile is a plot of the power over frequency.
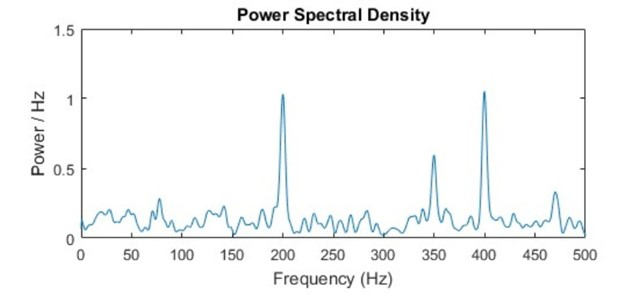
The figure shows the normalized distribution of power per unit of frequency (Power per Hertz) for different frequencies on the X-axis
Unit Of Power Spectral Density
The PSD gives the power level of all the frequency components present in the signal. So, the power profile is obtained for the entire range of frequencies of interest (termed bandwidth).
PSD is specified as W/Hz
Where, W = Power in Watt
Hz = Hertz, unit of frequency
Interpreting Power Spectral Densities
Let us arbitrarily assume a signal having bandwidth of 4 MHz and it is composed of four frequency components- 10 MHz, 11 MHz, 12 MHz and 13 MHz. Let us assume the power levels measured for these frequencies are 4W, 5W, 6W and 7W respectively.
For 11 MHz frequency component, the power level is 5W. So, the power per Mega Hertz is 5/11 W and the power per unit Hz is 5/11 μW/ Hz. Therefore, PSD is usually represented as the power level per Hz of frequency.
Signal frequency component: 11 MHz, Power level is 5 MHz
Power per Mega Hertz: 5/11 W
Power per unit Hertz: 5/11 µW = 0.454 μW
Benefits Of Power Spectral Density Profile
Using the PSD profile, we can identify the frequency components having relatively weaker power levels in the given frequency range of interest.
The received test signal (control signal) is studied using a spectrum analyzer. The PSD profile is studied and this is compared to the PSD of the test signal before it was transmitted through the channel.
By studying the PSD profile, we can determine the frequency components with reduced power levels as a result of channel noise. These frequency components have relatively been more vulnerable to the noise when compared to the other frequency components present in the signal.
We can therefore adjust the power levels of the signal to be transmitted to combat the effects of channel noise.
How Power Spectral Density is used to Classify Noise?
White Noise – Commonly found in Wireless Communication
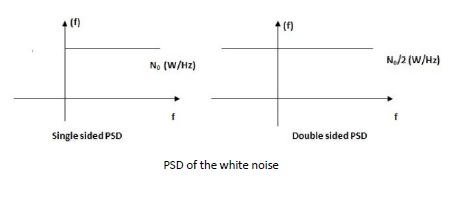
The most commonly used noise model in wireless communication systems is the ‘white’ noise model. The PSD profile of white noise is flat over frequency ranges. Thus, the PSD of white noise is uniform and is independent of the signal frequency components. White noise PSD is represented as a straight line parallel to the frequency axis in the PSD plot.
Pink Noise or Flicker Noise
Pink noise is also termed ‘flicker’ noise. In this noise model, the noise power is inversely proportional to the frequency. Thus, the noise power level is low for higher signal frequency components. The flicker noise is therefore termed ‘1/f’ noise because of this inverse relation between power and frequency.
Brown Noise also known as Popcorn Noise.
Brown noise is termed ‘1/f2’ noise. The rate of fall of the noise power with increasing signal frequency is higher than that in pink noise model. Brown noise is also called popcorn noise or avalanche noise.
Purple Noise
Purple noise is termed ‘f2’ noise. The noise power follows a quadratic relation with the signal frequency components.
Blue Noise
The noise power has a linear relation with the signal frequency component and this is termed ‘f’ noise.
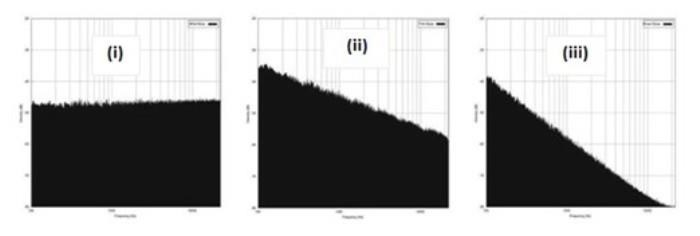
Y-axis: Power/Hz, X-axis: Frequency
PSD of white noise
PSD of pink noise
PSD of brown noise.

6K+ Views
