- Matplotlib - Home
- Matplotlib - Introduction
- Matplotlib - Vs Seaborn
- Matplotlib - Environment Setup
- Matplotlib - Anaconda distribution
- Matplotlib - Jupyter Notebook
- Matplotlib - Pyplot API
- Matplotlib - Simple Plot
- Matplotlib - Saving Figures
- Matplotlib - Markers
- Matplotlib - Figures
- Matplotlib - Styles
- Matplotlib - Legends
- Matplotlib - Colors
- Matplotlib - Colormaps
- Matplotlib - Colormap Normalization
- Matplotlib - Choosing Colormaps
- Matplotlib - Colorbars
- Matplotlib - Working With Text
- Matplotlib - Text properties
- Matplotlib - Subplot Titles
- Matplotlib - Images
- Matplotlib - Image Masking
- Matplotlib - Annotations
- Matplotlib - Arrows
- Matplotlib - Fonts
- Matplotlib - Font Indexing
- Matplotlib - Font Properties
- Matplotlib - Scales
- Matplotlib - LaTeX
- Matplotlib - LaTeX Text Formatting in Annotations
- Matplotlib - PostScript
- Matplotlib - Mathematical Expressions
- Matplotlib - Animations
- Matplotlib - Celluloid Library
- Matplotlib - Blitting
- Matplotlib - Toolkits
- Matplotlib - Artists
- Matplotlib - Styling with Cycler
- Matplotlib - Paths
- Matplotlib - Path Effects
- Matplotlib - Transforms
- Matplotlib - Ticks and Tick Labels
- Matplotlib - Radian Ticks
- Matplotlib - Dateticks
- Matplotlib - Tick Formatters
- Matplotlib - Tick Locators
- Matplotlib - Basic Units
- Matplotlib - Autoscaling
- Matplotlib - Reverse Axes
- Matplotlib - Logarithmic Axes
- Matplotlib - Symlog
- Matplotlib - Unit Handling
- Matplotlib - Ellipse with Units
- Matplotlib - Spines
- Matplotlib - Axis Ranges
- Matplotlib - Axis Scales
- Matplotlib - Axis Ticks
- Matplotlib - Formatting Axes
- Matplotlib - Axes Class
- Matplotlib - Twin Axes
- Matplotlib - Figure Class
- Matplotlib - Multiplots
- Matplotlib - Grids
- Matplotlib - Object-oriented Interface
- Matplotlib - PyLab module
- Matplotlib - Subplots() Function
- Matplotlib - Subplot2grid() Function
- Matplotlib - Anchored Artists
- Matplotlib - Manual Contour
- Matplotlib - Coords Report
- Matplotlib - AGG filter
- Matplotlib - Ribbon Box
- Matplotlib - Fill Spiral
- Matplotlib - Findobj Method
- Matplotlib - Hyperlinks
- Matplotlib - Image Thumbnail
- Matplotlib - Plotting with Keywords
- Matplotlib - Create Logo
- Matplotlib - Multipage PDF
- Matplotlib - Multiprocessing
- Matplotlib - Print Stdout
- Matplotlib - Compound Path
- Matplotlib - Sankey Class
- Matplotlib - MRI with EEG
- Matplotlib - Stylesheets
- Matplotlib - Background Colors
- Matplotlib - Basemap
Matplotlib Events
- Matplotlib - Event Handling
- Matplotlib - Close Event
- Matplotlib - Mouse Move
- Matplotlib - Click Events
- Matplotlib - Scroll Event
- Matplotlib - Keypress Event
- Matplotlib - Pick Event
- Matplotlib - Looking Glass
- Matplotlib - Path Editor
- Matplotlib - Poly Editor
- Matplotlib - Timers
- Matplotlib - Viewlims
- Matplotlib - Zoom Window
Matplotlib Widgets
- Matplotlib - Cursor Widget
- Matplotlib - Annotated Cursor
- Matplotlib - Button Widget
- Matplotlib - Check Buttons
- Matplotlib - Lasso Selector
- Matplotlib - Menu Widget
- Matplotlib - Mouse Cursor
- Matplotlib - Multicursor
- Matplotlib - Polygon Selector
- Matplotlib - Radio Buttons
- Matplotlib - RangeSlider
- Matplotlib - Rectangle Selector
- Matplotlib - Ellipse Selector
- Matplotlib - Slider Widget
- Matplotlib - Span Selector
- Matplotlib - Textbox
Matplotlib Plotting
- Matplotlib - Line Plots
- Matplotlib - Area Plots
- Matplotlib - Bar Graphs
- Matplotlib - Histogram
- Matplotlib - Pie Chart
- Matplotlib - Scatter Plot
- Matplotlib - Box Plot
- Matplotlib - Arrow Demo
- Matplotlib - Fancy Boxes
- Matplotlib - Zorder Demo
- Matplotlib - Hatch Demo
- Matplotlib - Mmh Donuts
- Matplotlib - Ellipse Demo
- Matplotlib - Bezier Curve
- Matplotlib - Bubble Plots
- Matplotlib - Stacked Plots
- Matplotlib - Table Charts
- Matplotlib - Polar Charts
- Matplotlib - Hexagonal bin Plots
- Matplotlib - Violin Plot
- Matplotlib - Event Plot
- Matplotlib - Heatmap
- Matplotlib - Stairs Plots
- Matplotlib - Errorbar
- Matplotlib - Hinton Diagram
- Matplotlib - Contour Plot
- Matplotlib - Wireframe Plots
- Matplotlib - Surface Plots
- Matplotlib - Triangulations
- Matplotlib - Stream plot
- Matplotlib - Ishikawa Diagram
- Matplotlib - 3D Plotting
- Matplotlib - 3D Lines
- Matplotlib - 3D Scatter Plots
- Matplotlib - 3D Contour Plot
- Matplotlib - 3D Bar Plots
- Matplotlib - 3D Wireframe Plot
- Matplotlib - 3D Surface Plot
- Matplotlib - 3D Vignettes
- Matplotlib - 3D Volumes
- Matplotlib - 3D Voxels
- Matplotlib - Time Plots and Signals
- Matplotlib - Filled Plots
- Matplotlib - Step Plots
- Matplotlib - XKCD Style
- Matplotlib - Quiver Plot
- Matplotlib - Stem Plots
- Matplotlib - Visualizing Vectors
- Matplotlib - Audio Visualization
- Matplotlib - Audio Processing
Matplotlib Useful Resources
- Matplotlib - Quick Guide
- Matplotlib - Cheatsheet
- Matplotlib - Useful Resources
- Matplotlib - Discussion
Matplotlib - Subplot2grid() Function
Matplotlib's subplot2grid() function allows you to create subplots within a grid layout and provides flexibility in specifying the location, rowspan, and colspan of each subplot. we'll explore the usage of subplot2grid() function with examples.
Understanding subplot2grid() Function
The subplot2grid() function is a part of the Matplotlib library and is available only in the functional interface (matplotlib.pyplot). It creates a subplot at a specific location inside a regular grid. It offers more flexibility in creating axes objects at precise locations within the grid and allows the axes to span across multiple rows or columns.
This function is similar to pyplot.subplot() function, but it uses 0-based indexing and two-dimensional Python slicing to select cells within a grid layout for placing subplots.
Following is the syntax of the function −
matplotlib.pyplot.subplot2grid(shape, loc, rowspan=1, colspan=1, fig=None, **kwargs)
Here are the details of its parameters −
- shape: Specifies the number of rows and columns in the grid.
- loc: Determines the position of the subplot within the grid.
- rowspan: Specifies the number of rows the subplot spans (default: 1).
- colspan: Specifies the number of columns the subplot spans (default: 1).
- fig: Optional parameter to specify the figure where the subplot is placed.
- **kwargs: Additional keyword arguments passed to add_subplot().
Example - Usage of subplot2grid() function
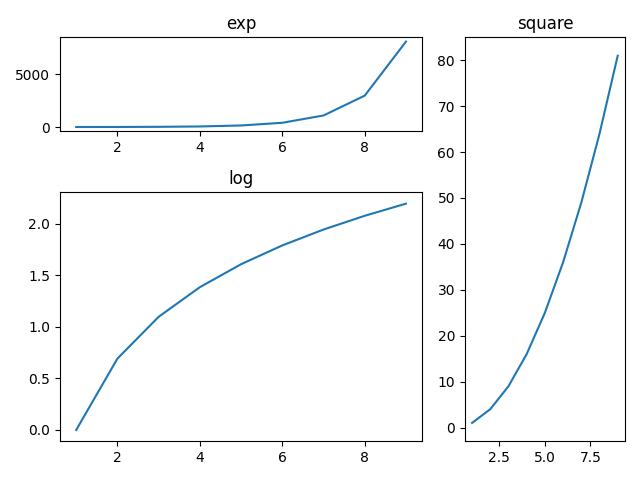
This example creates a 3x3 grid of subplots using subplot2grid(). Each subplot is positioned within the grid, and their sizes are adjusted using rowspan and colspan parameters.
import matplotlib.pyplot as plt

# Define subplot layout and create subplots
a1 = plt.subplot2grid((3,3),(0,0), colspan=2)
a2 = plt.subplot2grid((3,3),(0,2), rowspan=3)
a3 = plt.subplot2grid((3,3),(1,0), rowspan=2, colspan=2)

# Plot data on subplots
import numpy as np
x = np.arange(1, 10)
a1.plot(x, np.exp(x))
a1.set_title('exp')

a2.plot(x, x*x)
a2.set_title('square')

a3.plot(x, np.log(x))
a3.set_title('log')

plt.tight_layout()
plt.show()
Output
On executing the above code we will get the following output −
Example - Defining Multiple Subplots
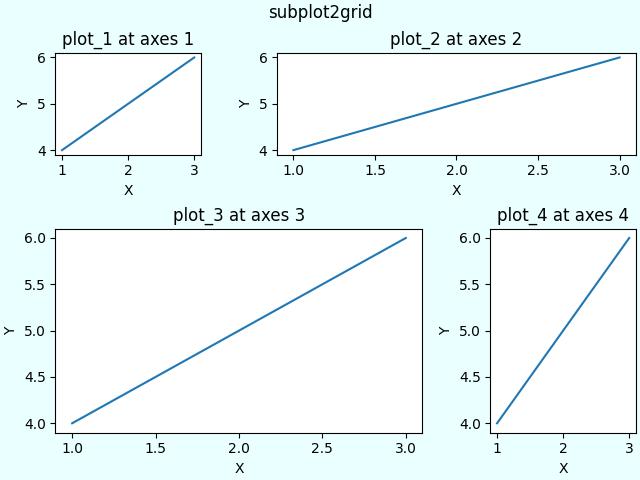
In this example, we create a figure with a constrained layout and define 4 subplots using the subplot2grid() function. Each subplot's position and size are specified within the grid.
import matplotlib.pyplot as plt

# Function to create plot
def draw_plot(ax, title):
    ax.plot([1, 2, 3], [4, 5, 6])
    ax.set_xlabel('X')
    ax.set_ylabel('Y')
    ax.set_title(title)

# Create a figure with constrained layout
fig = plt.figure(layout="constrained", facecolor='#eaffff')

# Define subplot layout using subplot2grid
ax1 = plt.subplot2grid((3, 3), (0, 0))
ax2 = plt.subplot2grid((3, 3), (0, 1), colspan=2)
ax3 = plt.subplot2grid((3, 3), (1, 0), colspan=2, rowspan=2)
ax4 = plt.subplot2grid((3, 3), (1, 2), rowspan=2)

# Plot data on subplots
draw_plot(ax1, 'plot_1 at axes 1')
draw_plot(ax2, 'plot_2 at axes 2')
draw_plot(ax3, 'plot_3 at axes 3')
draw_plot(ax4, 'plot_4 at axes 4')

# Add a title to the figure
fig.suptitle('subplot2grid')

plt.show()
Output
On executing the above code we will get the following output −
Example - Large Number of Subplots
Here's another example that creates a layout with a larger number of subplots.
import matplotlib.pyplot as plt

# Function to create plot
def draw_plot(ax, title):
    ax.plot([1, 2, 3], [4, 5, 6])
    ax.set_xlabel('X')
    ax.set_ylabel('Y')
    ax.set_title(title)

# Create a figure with constrained layout
fig = plt.figure(layout="constrained", facecolor='#eaffff')

# Define subplot layout using subplot2grid
ax1 = plt.subplot2grid((3, 3), (0, 0), colspan=3)
ax2 = plt.subplot2grid((3, 3), (1, 0), colspan=2)
ax3 = plt.subplot2grid((3, 3), (1, 2), rowspan=2)
ax4 = plt.subplot2grid((3, 3), (2, 0))
ax5 = plt.subplot2grid((3, 3), (2, 1))

# Plot data on subplots
draw_plot(ax1, 'plot_1 at axes 1')
draw_plot(ax2, 'plot_2 at axes 2')
draw_plot(ax3, 'plot_3 at axes 3')
draw_plot(ax4, 'plot_4 at axes 4')
draw_plot(ax5, 'plot_5 at axes 5')

# Add a title to the figure
fig.suptitle('subplot2grid')
plt.show()
Output
On executing the above code we will get the following output −

