 Data Structure
 Networking
 RDBMS
RDBMS Operating System
 Java
Java MS Excel
 iOS
iOS HTML
HTML CSS
CSS Android
 Python
 C Programming
 C++
C++ C#
C# MongoDB
 MySQL
MySQL Javascript
 PHP
PHP
- Selected Reading
- UPSC IAS Exams Notes
- Developer's Best Practices
- Questions and Answers
- Effective Resume Writing
- HR Interview Questions
- Computer Glossary
- Who is Who
Plotting a Sawtooth Wave using Matplotlib
In signal processing and waveform analysis, the sawtooth wave holds significant importance which can be plotted using Matplotlib. Understanding its behavior and visualizing it can aid in various applications, such as audio synthesis and digital communications.
This article explores how to generate and plot a sawtooth wave using the powerful Python library Matplotlib. With step-by-step explanations and example code, we delve into the fundamentals of creating a sawtooth wave, adjusting its parameters, and visualizing it using Matplotlib's plotting capabilities.
What is Sawtooth wave?
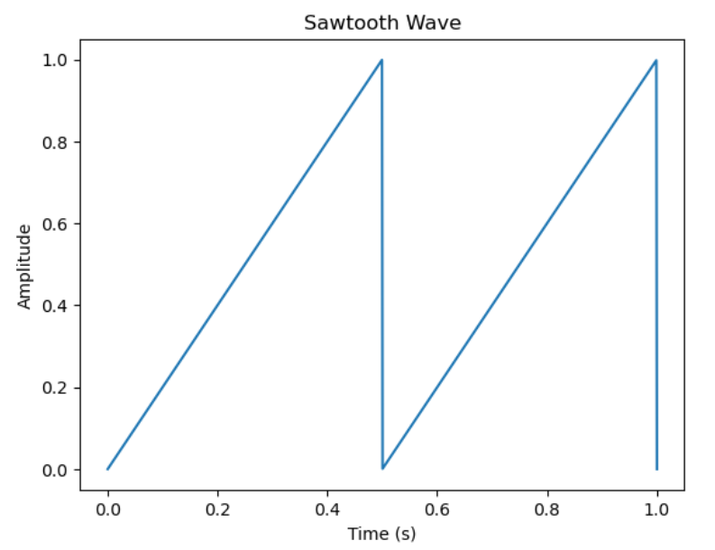
A sawtooth wave is a type of periodic waveform that resembles the teeth of a saw blade, hence its name. It is characterized by a linear rise in amplitude followed by a sudden drop back to its starting point. The waveform starts at a minimum or zero amplitude and then increases linearly until it reaches its maximum value.
At this point, it rapidly drops back to the minimum or zero amplitude, completing one cycle. Sawtooth waves are commonly used in music synthesis, modulation techniques, and digital signal processing due to their harmonic content and unique characteristics.
How to plot a sawtooth wave using Matplotlib?
Below are the steps that we will follow for plotting a sawtooth wave using Matplotlib ?
We start by importing the necessary libraries: numpy and matplotlib.pyplot. numpy provides efficient numerical computation capabilities, and matplotlib.pyplot is a sub-library of Matplotlib used for creating plots.
The program defines three parameters of the sawtooth wave ?
amplitude ? Represents the peak value of the wave. It determines how high the peaks and troughs of the wave will be.
frequency ? Specifies the number of cycles the wave completes per second. It determines the spacing between the peaks of the wave.
duration ? Represents the length of time the wave will be plotted for.
The sampling_rate is defined as the number of samples taken per second. In this program, we set it to 1000, meaning we will have 1000 samples per second.
The variable num_samples is calculated by multiplying the sampling_rate by the duration. It represents the total number of samples in the waveform.
We generate an array of time values using np.linspace(). This function creates an array of num_samples equally spaced time values between 0 and duration. These time values will be used as the x-axis for the plot.
The number of cycles completed at each time point is calculated by multiplying the frequency by the time array. This gives us a continuous increasing value that represents the number of cycles completed over time.
The sawtooth waveform is generated using the formula sawtooth = amplitude * (cycles - np.floor(cycles)). This formula generates values ranging from 0 to amplitude, forming the sawtooth shape. We subtract the floored value of cycles to ensure that the sawtooth wave repeats for every integer value of cycles.
The plt.plot() function is used to create the plot of the sawtooth wave. We pass the time array as the x-values and sawtooth as the y-values. This function connects the points in the plot with lines, resulting in a continuous waveform.
We set the title of the plot using plt.title() and label the x and y axes using plt.xlabel() and plt.ylabel(), respectively. This helps provide a clear understanding of the plotted waveform.
Finally, we use plt.show() to display the plot on the screen. The plot will appear in a separate window, showing the sawtooth waveform based on the provided parameters.
We can adjust the amplitude, frequency, and duration values to modify the characteristics of the sawtooth wave.
Example
import numpy as np
import matplotlib.pyplot as plt

# Define the parameters of the sawtooth wave
amplitude = 1.0  # Amplitude of the wave
frequency = 2.0  # Frequency of the wave in Hz
duration = 1.0   # Duration of the wave in seconds

# Generate the time values for the x-axis
sampling_rate = 1000  # Number of samples per second
num_samples = int(sampling_rate * duration)
time = np.linspace(0, duration, num_samples)

# Generate the y-values for the sawtooth wave
cycles = frequency * time
sawtooth = amplitude * (cycles - np.floor(cycles))

# Plot the sawtooth wave
plt.plot(time, sawtooth)

# Set the plot title and labels for the x and y axes
plt.title('Sawtooth Wave')
plt.xlabel('Time (s)')
plt.ylabel('Amplitude')

# Show the plot
plt.show()

Conclusion
In this article, we have explored how to generate and plot a sawtooth wave using Matplotlib. By understanding the parameters that define the wave and utilizing Matplotlib's plotting functions, we can visualize and analyze the sawtooth waveform. With this knowledge, we can now harness the power of sawtooth waves in various signal processing applications.

