 Data Structure
 Networking
 RDBMS
RDBMS Operating System
 Java
Java MS Excel
 iOS
iOS HTML
HTML CSS
CSS Android
 Python
 C Programming
 C++
C++ C#
C# MongoDB
 MySQL
MySQL Javascript
 PHP
PHP
- Selected Reading
- UPSC IAS Exams Notes
- Developer's Best Practices
- Questions and Answers
- Effective Resume Writing
- HR Interview Questions
- Computer Glossary
- Who is Who
How to Create a Pie Chart in Seaborn?
One of the most commonly used types of graphs in data visualisation is the pie chart. A pie chart is a circular chart that is divided into slices to represent the proportion of different categories in a dataset.
Seaborn is a Python data visualization library that is built on top of Matplotlib, which is another popular Python visualization library. Seaborn provides a high-level interface for creating a wide range of statistical graphics and can produce more sophisticated and aesthetically pleasing visualizations than Matplotlib.
Matplotlib is a low-level library for creating basic graphs and charts in Python. It provides the building blocks for creating more complex visualizations, but requires more code to generate visualizations than Seaborn. Seaborn simplifies the process of creating complex visualizations by providing a set of default themes and aesthetics.
Seaborn provides a set of functions for creating various types of statistical plots such as scatter plots, line plots, and bar charts. It also provides functions for creating more specialised types of plots such as heat maps, violin plots, and factor plots. These plots are designed to highlight relationships and patterns in data.
Here are the steps to install Seaborn and Matplotlib using Python ?
Open a command prompt or terminal window.
-
Check whether Python is installed on your system by typing the following command: python --version
If Python is installed, the version number will be displayed. If Python is not installed, download and install Python from the official website.
Install Seaborn using pip by typing the following command: "pip3 install seaborn"
Install Matplotlib using pip by typing the following command: "pip3 install matplotlib"
Now let's focus on the examples.
Example
Consider the code shown below.
# Importing libraries
import matplotlib.pyplot as plt
import seaborn as sns

# Declaring data

# sample data, replace with your own
data = [76, 84, 62, 93, 79]

# labels for data, replace with your own
keys = ['Class A', 'Class B', 'Class C', 'Class D', 'Class E']

# Plotting data on chart
plt.pie(data, labels=keys, autopct='%.0f%%')

# Add title to the chart
plt.title('Distribution of grades across different classes')

# Displaying chart
plt.show()
Explanation
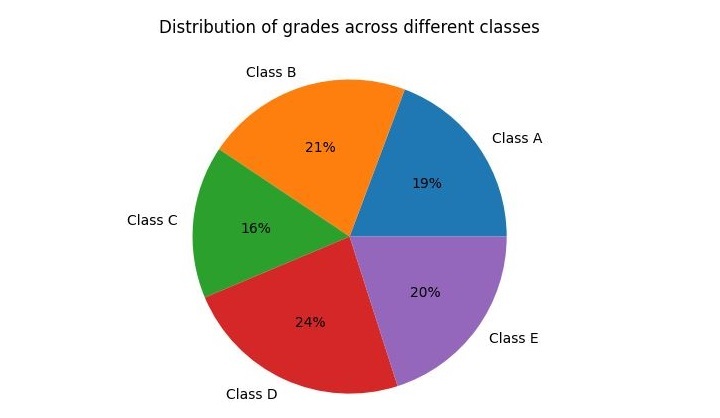
We declare the data variable, which contains a list of values for each class, and the keys variable, which contains the labels for each class.
We define the colour palette to use for the chart using the seaborn.color_palette() function.
We plot the data on the chart using the plt.pie() function. We pass in the data, keys, colours, and autopct arguments to customize the appearance of the chart. The autopct argument formats the percentages displayed on the chart.
We add a title to the chart using the plt.title() function.
We display the chart using the plt.show() function.
Output
Once you execute this code, a new window will pop up with our Pie chart inside it.

Example
Let's take another example to understand better how it works. Consider the code shown below.
# Importing libraries
import matplotlib.pyplot as plt
import seaborn as sns

# Declaring data

# sample data, replace with your own
data = [60, 25, 35, 45, 55]

# labels for data, replace with your own
keys = ['Category A', 'Category B', 'Category C', 'Category D', 'Category E']

# Declaring exploding pie
explode = [0.1, 0, 0, 0, 0.1]

# Define Seaborn color palette to use
palette_color = sns.color_palette('dark')

# Plotting data on chart
plt.pie(data, labels=keys, colors=palette_color,
 explode=explode, autopct='%.0f%%')

# Add title to the chart
plt.title('Distribution of items across different categories')

# Displaying chart
plt.show()
Explanation
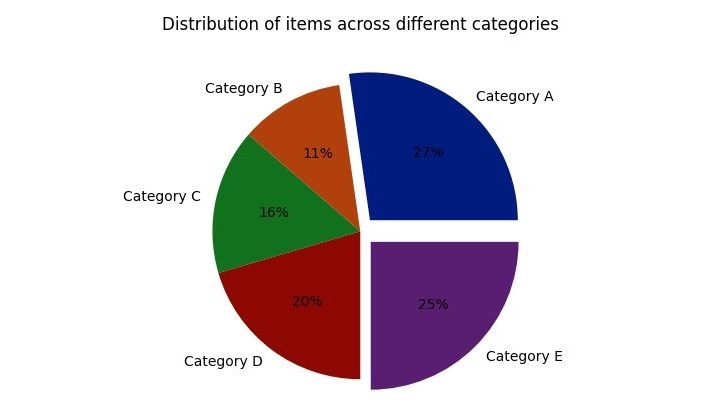
We've updated the data variable to contain a new set of values for each category. You can replace this with your own data.
We've updated the keys variable to contain new labels for each category. You can replace this with your own labels.
We've declared an explode variable, which specifies how much to explode each slice of the pie chart. In this example, we've exploded the first and last slices. You can modify this to suit your needs.
We've updated the Seaborn color palette to use a dark color scheme. You can choose a different palette if you prefer.
We've added a title to the chart using the plt.title() function.
We've displayed the chart using the plt.show() function.
Output
Once we run this code, a new window will pop up with our Pie chart inside it.

Conclusion
In conclusion, creating a pie chart with Seaborn and Matplotlib is a straightforward process that can be completed in just a few steps. By importing the necessary libraries, declaring the data and defining the color palette, you can easily plot a pie chart that displays the distribution of values across different categories.

