 Data Structure
 Networking
 RDBMS
RDBMS Operating System
 Java
Java MS Excel
 iOS
iOS HTML
HTML CSS
CSS Android
 Python
 C Programming
 C++
C++ C#
C# MongoDB
 MySQL
MySQL Javascript
 PHP
PHP
- Selected Reading
- UPSC IAS Exams Notes
- Developer's Best Practices
- Questions and Answers
- Effective Resume Writing
- HR Interview Questions
- Computer Glossary
- Who is Who
How to plot pie-chart with a single pie highlighted with Python Matplotlib?
Introduction..
What is your most favorite chart type ? If you ask this question to management or a business analyst, the immediate answer is Pie charts!. It is a very common way of presenting percentages.
How to do it..
1. Install matplotlib by following command.
pip install matplotlib
2. Import matplotlib
import matplotlib.pyplot as plt
3. Prepare temporary data.
tennis_stats = (('Federer', 20),('Nadal', 20),('Djokovic', 17),('Murray', 3),)
4. Next step is to prepare the data.
titles = [title for player, title in tennis_stats]
players = [player for player, title in tennis_stats]
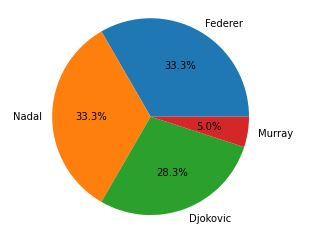
5. Create the pie chart with the values as titles and labels as player names.
autopct parameter - To formats the value so it displays it as a percentage to a single decimal place. axis('equals') - To ensure the pie chart will look round. .show - To display the resulting graph.
Note- Executing .show blocks the execution of the program. The program will resume when you close the window.
plt.pie(titles, labels=players, autopct='%1.1f%%')
plt.gca().axis('equal')
(-1.1000000175619362,
1.1000000072592333,
-1.1090350248729983,
1.100430247887797)

6. Show the graph.
plt.show()
7. There are couple of intresting parameters to play around with the pie/s. startangle - Rotating the start of the wedges/pies.
counterclock - The direction you want to setup, default is True.
plt.pie(titles, labels=players, startangle=60, counterclock=False,autopct='%1.1f%%')
plt.show()

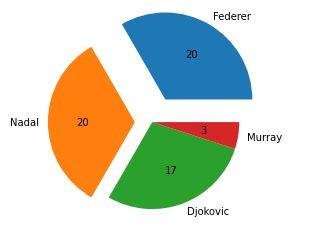
8. Now for some people like me the percentages mean nothing. Remeber the output graph is sent to some one who has no clue of the values which are hiding deep inside your code. So instead of percentages, which obviously is self-explanatory from the way the pie's split can we show the actual titles ?.
Well, that is a bit tricky as you need to write a custom function. Have a look at below.
I will create a custom function - format_values to create a dictionary with key as percentage, so we can retrieve the referenced value.
Example
from matplotlib.ticker import FuncFormatter
total = sum(title for player, title in tennis_stats)
print(total)
values = {int(100 * title / total): title for player, title in tennis_stats}
print(values)

def format_values(percent, **kwargs):
value = values[int(percent)]
return '{}'.format(value)

# explode to seperate the pie/wedges.
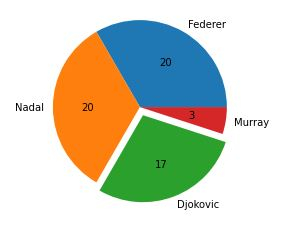
explode = (0, 0, 0.1, 0.0)
plt.pie(titles, labels=players, explode=explode, autopct=format_values)

plt.show()

# the more the value the more farther it will be seperated.
explode = (0.3, 0.2, 0.0, 0.0)
plt.pie(titles, labels=players, explode=explode, autopct=format_values)
60
{33: 20, 28: 17, 5: 3}

([<matplotlib.patches.Wedge at 0x2279cf8dd00>,
<matplotlib.patches.Wedge at 0x2279cf9b1f0>,
<matplotlib.patches.Wedge at 0x2279cf9b8b0>,
<matplotlib.patches.Wedge at 0x2279cf9bf70>],
[Text(0.6999999621611965, 1.2124355871444568, 'Federer'),
Text(-1.2999999999999945, -1.2171478395895002e-07, 'Nadal'),
Text(0.39420486628845763, -1.0269384223966398, 'Djokovic'),
Text(1.086457194390738, -0.17207778693546258, 'Murray')],
[Text(0.44999997567505484, 0.7794228774500078, '20'),
Text(-0.7999999999999966, -7.490140551320001e-08, '20'),
Text(0.2150208361573405, -0.5601482303981671, '17'),
Text(0.5926130151222206, -0.09386061105570685, '3')])

Finally, putting everything together.
Example
# imports
import matplotlib.pyplot as plt
from matplotlib.ticker import FuncFormatter

# prepare data
tennis_stats = (('Federer', 20),('Nadal', 20),('Djokovic', 17),('Murray', 3),)

titles = [title for player, title in tennis_stats]
players = [player for player, title in tennis_stats]

total = sum(title for player, title in tennis_stats)
values = {int(100 * title / total): title for player, title in tennis_stats}

# custom function
def format_values(percent, **kwargs):
value = values[int(percent)]
return '{}'.format(value)

# explode to seperate the pie/wedges.
explode = (0, 0, 0.1, 0.0)
plt.pie(titles, labels=players, explode=explode, autopct=format_values)

plt.show()


