
Article Categories
- All Categories
-
 Data Structure
-
 Networking
-
 RDBMS
RDBMS
-
 Operating System
-
 Java
Java
-
 MS Excel
-
 iOS
iOS
-
 HTML
HTML
-
 CSS
CSS
-
 Android
-
 Python
-
 C Programming
-
 C++
C++
-
 C#
C#
-
 MongoDB
-
 MySQL
MySQL
-
 Javascript
-
 PHP
PHP
-
 Economics & Finance
Maximum Likelihood in Machine Learning
Introduction
Maximum likelihood is an approach commonly used for such density estimation problems, in which a likelihood function is defined to get the probabilities of the distributed data. It is imperative to study and understand the concept of maximum likelihood as it is one of the primary and core concepts essential for learning other advanced machine learning and deep learning techniques and algorithms.
In this article, we will discuss the likelihood function, the core idea behind that, and how it works with code examples. This will help one to understand the concept better and apply the same when needed.
Let us dive into the likelihood first to understand the maximum likelihood estimation.
What is the Likelihood?
In machine learning, the likelihood is a measure of the data observations up to which it can tell us the results or the target variables value for particular data points. In simple words, as the name suggests, the likelihood is a function that tells us how likely the specific data point suits the existing data distribution.
For example. Suppose there are two data points in the dataset. The likelihood of the first data point is greater than the second. In that case, it is assumed that the first data point provides accurate information to the final model, hence being likable for the model being informative and precise.
After this discussion, a gentle question may appear in your mind, If the working of the likelihood function is the same as the probability function, then what is the difference?
Difference Between Probability and Likelihood
Although the working and intuition of both probability and likelihood appear to be the same, there is a slight difference, here the possibility is a function that defines or tells us how accurate the particular data point is valuable and contributes to the final algorithm in data distribution and how likely is to the machine learning algorithm.
Whereas probability, in simple words is a term that describes the chance of some event or thing happening concerning other circumstances or conditions, mostly known as conditional probability.
Also, the sum of all the probabilities associated with a particular problem is one and can not exceed it, whereas the likelihood can be greater than one.
What is Maximum Likelihood Estimation?
After discussing the intuition of the likelihood function, it is clear to us that a higher likelihood is desired for every model to get an accurate model and has accurate results. So here, the term maximum likelihood represents that we are maximizing the likelihood function, called the Maximization of the Likelihood Function.
Let us try to understand the same with an example.
Let us suppose that we have a classification dataset in which the independent column is the marks of the students that they achieved in the particular exam, and the target or dependent column is categorical, which has yes and No attributes representing if students are placed on the campus placements or not.
Noe here, if we try to solve the same problem with the help of maximum likelihood estimation, the function will first calculate the probability of every data point according to every suitable condition for the target variable. In the next step, the function will plot all the data points in the two-dimensional plots and try to find the line that best fits the dataset to divide it into two parts. Here the best-fit line will be achieved after some epochs, and once achieved, the line is used to classify the data point by simply plotting it to the graph.
Maximum Likelihood: The Base
The maximum likelihood estimation is a base of some machine learning and deep learning approaches used for classification problems. One example is logistic regression, where the algorithm is used to classify the data point using the best-fit line on the graph. The same approach is known as the perceptron trick regarding deep learning algorithms.
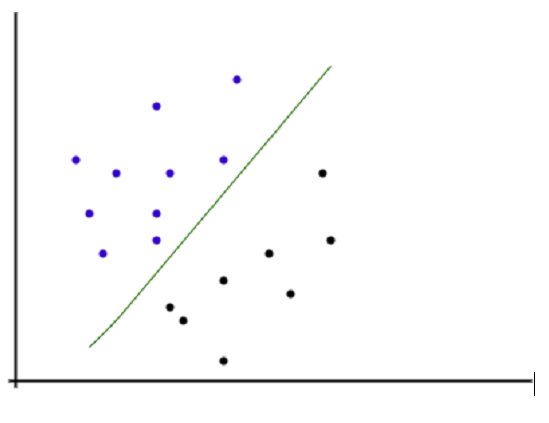
As shown in the above image, all the data observations are plotted in a two-dimensional diagram where the X-axis represents the independent column or the training data, and the y-axis represents the target variable. The line is drawn to separate both data observations, positives and negatives. According to the algorithm, the observations that fall above the line are considered positive, and data points below the line are regarded as negative data points.
Maximum Likelihood Estimation: Code Example
We can quickly implement the maximum likelihood estimation technique using logistic regression on any classification dataset. Let us try to implement the same.
<div class="code-mirror  language-python" contenteditable="plaintext-only" spellcheck="false" style="outline: none; overflow-wrap: break-word; overflow-y: auto; white-space: pre-wrap;"><span class="token keyword">import</span> pandas <span class="token keyword">as</span> pd
<span class="token keyword">import</span> numpy <span class="token keyword">as</span> np
<span class="token keyword">import</span> seaborn <span class="token keyword">as</span> sns
<span class="token keyword">from</span> sklearn<span class="token punctuation">.</span>linear_model <span class="token keyword">import</span> LogisticRegression
lr<span class="token operator">=</span>LogisticRegression<span class="token punctuation">(</span><span class="token punctuation">)</span>
lr<span class="token punctuation">.</span>fit<span class="token punctuation">(</span>X_train<span class="token punctuation">,</span>y_train<span class="token punctuation">)</span>
lr_pred<span class="token operator">=</span>lr<span class="token punctuation">.</span>predict<span class="token punctuation">(</span>X_test<span class="token punctuation">)</span>
sns<span class="token punctuation">.</span>regplot<span class="token punctuation">(</span>x<span class="token operator">=</span><span class="token string">"X"</span><span class="token punctuation">,</span>y<span class="token operator">=</span><span class="token string">'lr_pred'</span><span class="token punctuation">,</span>data<span class="token operator">=</span>df_pred <span class="token punctuation">,</span>logistic<span class="token operator">=</span><span class="token boolean">True</span><span class="token punctuation">,</span> ci<span class="token operator">=</span><span class="token boolean">None</span><span class="token punctuation">)</span>
</div>
The above code will fit the logistic regression for the given dataset and generate the line plot for the data representing the distribution of the data and the best fit according to the algorithm.
Key Takeaways
Maximum Likelihood is a function that describes the data points and their likeliness to the model for best fitting.
Maximum likelihood is different from the probabilistic methods, where probabilistic methods work on the principle of calculation probabilities. In contrast, the likelihood method tries o maximize the likelihood of data observations according to the data distribution.
Maximum likelihood is an approach used for solving the problems like density distribution and is a base for some algorithms like logistic regression.
The approach is very similar and is predominantly known as the perceptron trick in terms of deep learning methods.
Conclusion
In this article, we discussed the likelihood function, maximum likelihood estimation, its core intuition, and working mechanism with practical examples associated with some key takeaways. This will help one understand the maximum likelihood better and more deeply and help answer interview questions related to the same very efficiently.

21K+ Views
