
Article Categories
- All Categories
-
 Data Structure
-
 Networking
-
 RDBMS
RDBMS
-
 Operating System
-
 Java
Java
-
 MS Excel
-
 iOS
iOS
-
 HTML
HTML
-
 CSS
CSS
-
 Android
-
 Python
-
 C Programming
-
 C++
C++
-
 C#
C#
-
 MongoDB
-
 MySQL
MySQL
-
 Javascript
-
 PHP
PHP
-
 Economics & Finance
Robust Correlation in Machine Learning
In this Tutorial, we are going to learn about Robus Correlation in Machine Learning. Understanding and evaluating distinct correlations can be useful in a variety of businesses.
What is Correlation?
The statistical connection between two entities is known as correlation. Alternatively said, it describes the relationship between the movements of two variables. Different data sets can also be used using correlation. You can have guessed how certain events would link to one another in some circumstances, but in other situations, the correlation may have surprised you. It's critical to recognize that correlation does not imply causation. An illustration of the fit of the data is a scatterplot. Generally speaking, a scatterplot can be used to assess if there is a correlation between the variables or not.
Different types of correlation
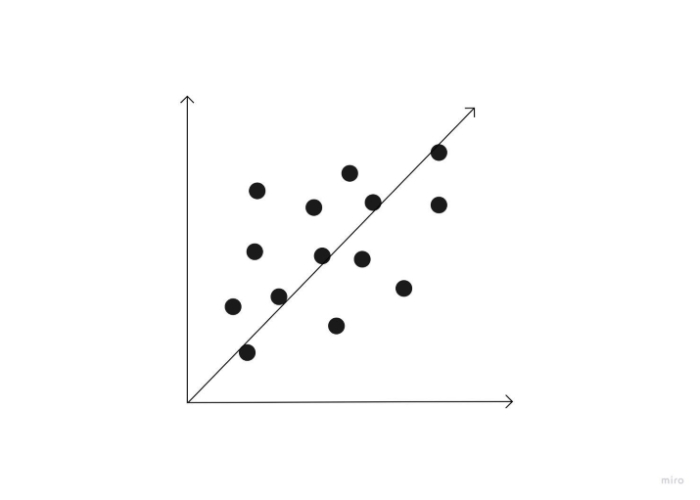
Positive correlation
If both of the variables in a connection move in the same direction, the connection is said to have a positive correlation. Consequently, when one variable rises as the other rises, or when one variable falls as the other falls. Height and weight are two variables that show a favorable link.
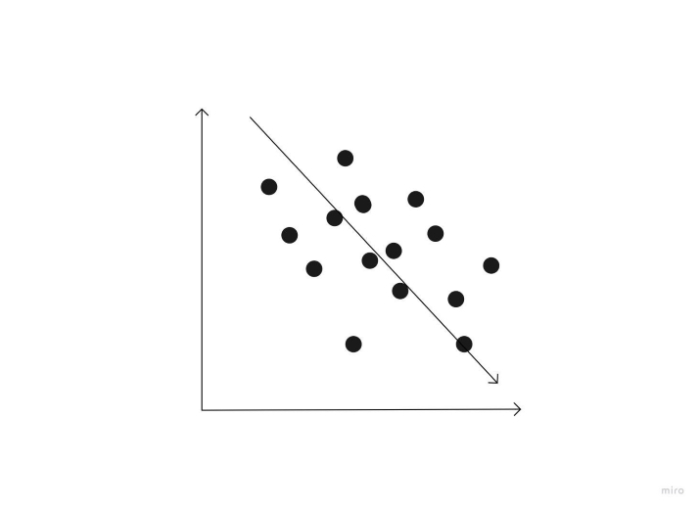
Negative correlation
A negative correlation is a link between two variables in which a rise in one causes a decrease in the other. Height above sea level and temperature are two examples of negative correlations. It gets colder as you ascend the mountain (raise in height) (decrease in temperature).
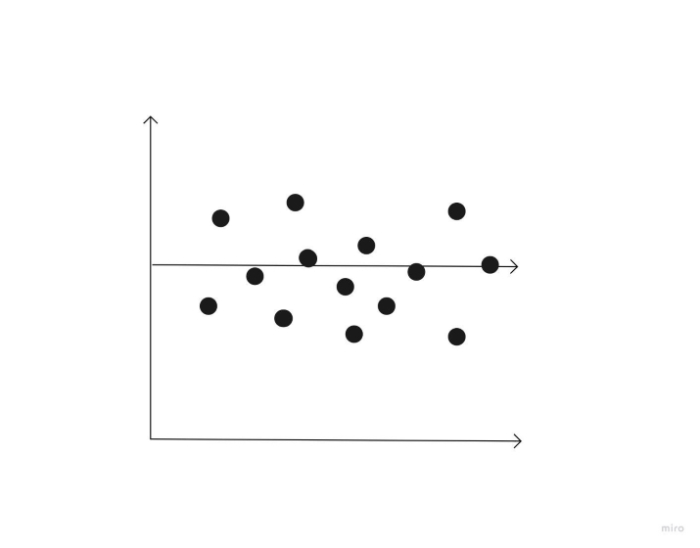
Zero correlation
A correlation of 0 indicates that the two variables have no relationship. In other words, when one variable travelled in one direction, the other moved in a completely another one.
What is the correlation coefficient?
The statistical measure of how well changes in the value of one variable predict changes in the value of another is called a correlation coefficient. There is a propensity to assume that a change in one variable must be the result of a change in the other when that change can be accurately predicted by a change in another variable. Correlation does not, however, prove causality. It's possible that both variables are affected similarly by an unidentified component. When it comes to the patterns of consumer data, knowing the difference between correlation and causation can be useful and offer insightful information.
A correlation coefficient evaluates how closely two variables are related, whereas correlation analyzes how two things connect to one another. Three different forms of correlation coefficients exist in statistics.
Here are some of them ?
Pearson correlation ? The most popular method for determining if two variables have a linear connection is the Pearson correlation. It will be closer to +1 or -1 depending on how strongly these two datasets are correlated. For instance, Pearson r correlation is used to evaluate the degree of a stock market association between two securities when determining how two securities are related to one another.
Spearman correlation ? This kind of correlation is employed to ascertain the monotonic link or relationship between two datasets. It employs skewed or ordinal variables rather than regularly distributed ones, unlike the Pearson correlation coefficient, and is based on the ranking values for each dataset. When the variables are assessed on at least an ordinal scale, it is suitable correlation analysis. This coefficient necessitates a data table including the raw data, its rankings, and the difference between the two ranks.
Kendall correlation ? This kind of correlation assesses how strongly two datasets are dependent on one another. A non-parametric test called Kendall rank correlation assesses the degree of reliance between two variables.
Which form of correlation coefficient you will employ depends on your knowledge of your variables. Your ability to comprehend the link between the datasets you're examining will improve with the use of the appropriate correlation equation.
Formulae correlation
To determine correlation, use the following equation ?
$$\mathrm{\frac{(x(i) ? x)(y(i) ? \bar{y})}{\sum(x(i) ? \bar(x))^2 \: \sum(y(i) ? (\bar{y}))^2}}$$
Consider the following representations for determining a correlation ?
- x(i) = the value of x
- y(i) = the value of y
- x?= the mean of the x-value
- ?= the mean of the y-value
How to calculate correlation?
Correlation can be calculated using a variety of techniques. This page goes into further detail on the most used technique, the Pearson product-moment correlation. The Pearson product-moment correlation analyzes a pair of variables' linear connections. Any dataset with a finite covariance matrix is suitable for using it.
Here are the procedures for computing correlation.
Collect information for your x-variable and y-variable.
The x-mean variables should be determined, as well as the y-mean. variable's
Take away from each value of the x-variable the mean value of the x-variable. For the y-variable, repeat this procedure.
Divide each difference between the mean and value of the x-variable by the corresponding difference in the y-variable.
Add the answers by squaring each of these differences.
Calculate the square root of the value from Step 5.
Divide the result of Step 4 by the result of Step 6.
Conclusion
By observing and comparing consumers' responses to various marketing strategies, marketing experts utilize correlation analysis to assess the effectiveness of a campaign. They are better able to comprehend and assist their clients in this way.
Correlation analysis is very helpful for root cause analysis and decreases time to discovery (TTD) and remediation for data scientists and those responsible for monitoring data (TTR). Finding the root of an issue can be made easier by seeing two unexpected occurrences or anomalies at the same time or rate. If an issue can be recognized and resolved earlier, the cost to the organization will be lower.
Correlations are frequently employed in a psychology study, however, it's crucial to realize that correlation does not imply causation. It is your best buddy if you enjoy working with data. It assumes a cause-and-effect relationship that may not exist and is a common misconception among those who are unfamiliar with statistics.

584 Views
