
Article Categories
- All Categories
-
 Data Structure
-
 Networking
-
 RDBMS
RDBMS
-
 Operating System
-
 Java
Java
-
 MS Excel
-
 iOS
iOS
-
 HTML
HTML
-
 CSS
CSS
-
 Android
-
 Python
-
 C Programming
-
 C++
C++
-
 C#
C#
-
 MongoDB
-
 MySQL
MySQL
-
 Javascript
-
 PHP
PHP
-
 Economics & Finance
Selected Reading
How to save a plot in pdf in R?
To save a plot in pdf, we can use the pdf function in base R. For example, if we want to save a plot with the name PDF then it can be done using the below command −
pdf("PDF.pdf")
After this we can create the plot and use dev.off().
Example
pdf("pdfExample.pdf")
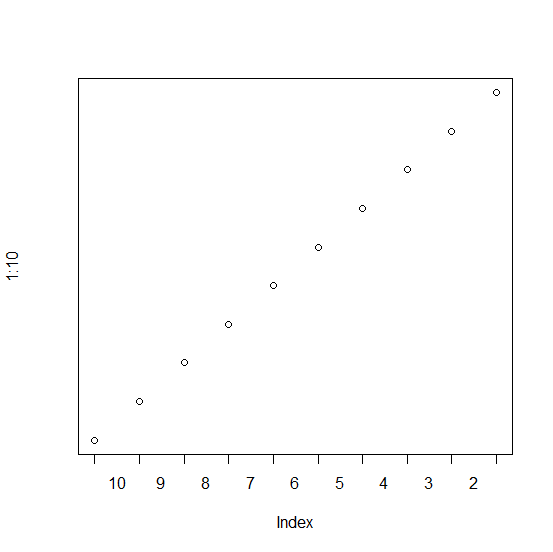
plot(1:10)
Output
Example
dev.off()
Output
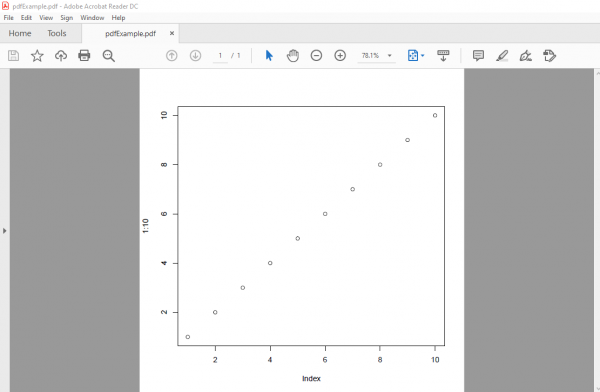
To check where it is saved, find the working directory using getwd().

Updated on: 2026-03-11T22:50:55+05:30
4K+ Views

Advertisements