
Article Categories
- All Categories
-
 Data Structure
-
 Networking
-
 RDBMS
RDBMS
-
 Operating System
-
 Java
Java
-
 MS Excel
-
 iOS
iOS
-
 HTML
HTML
-
 CSS
CSS
-
 Android
-
 Python
-
 C Programming
-
 C++
C++
-
 C#
C#
-
 MongoDB
-
 MySQL
MySQL
-
 Javascript
-
 PHP
PHP
-
 Economics & Finance
Selected Reading
Save the plots into a PDF in matplotlib
Using plt.savefig("myImagePDF.pdf", format="pdf", bbox_inches="tight") method, we can save a figure in PDF format.
Steps
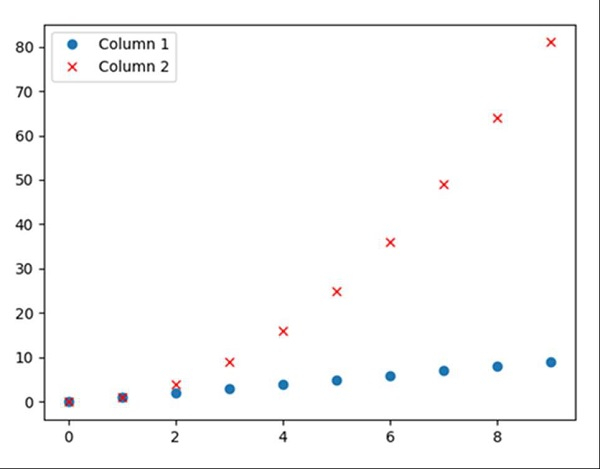
Create a dictionary with Column 1 and Column 2 as the keys and Values are like i and i*i, where i is from 0 to 10, respectively.
Create a data frame using pd.DataFrame(d), d created in step 1.
Plot the data frame with ?o? and ?rx? style.
To save the file in PDF format, use savefig() method where the image name is myImagePDF.pdf, format = "pdf".
To show the image, use the plt.show() method.
Example
<span class="kwd">import</span><span class="pln"> pandas </span><span class="kwd">as</span><span class="pln"> pd
</span><span class="kwd">from</span><span class="pln"> matplotlib </span><span class="kwd">import</span><span class="pln"> pyplot </span><span class="kwd">as</span><span class="pln"> plt

d </span><span class="pun">=</span><span class="pln"> </span><span class="pun">{</span><span class="str">'Column 1'</span><span class="pun">:</span><span class="pln"> </span><span class="pun">[</span><span class="pln">i </span><span class="kwd">for</span><span class="pln"> i </span><span class="kwd">in</span><span class="pln"> range</span><span class="pun">(</span><span class="lit">10</span><span class="pun">)],</span><span class="pln"> </span><span class="str">'Column 2'</span><span class="pun">:</span><span class="pln"> </span><span class="pun">[</span><span class="pln">i </span><span class="pun">*</span><span class="pln"> i </span><span class="kwd">for</span><span class="pln"> i </span><span class="kwd">in</span><span class="pln"> range</span><span class="pun">(</span><span class="lit">10</span><span class="pun">)]}</span><span class="pln">

df </span><span class="pun">=</span><span class="pln"> pd</span><span class="pun">.</span><span class="typ">DataFrame</span><span class="pun">(</span><span class="pln">d</span><span class="pun">)</span><span class="pln">

df</span><span class="pun">.</span><span class="pln">plot</span><span class="pun">(</span><span class="pln">style</span><span class="pun">=[</span><span class="str">'o'</span><span class="pun">,</span><span class="pln"> </span><span class="str">'rx'</span><span class="pun">])</span><span class="pln">
plt</span><span class="pun">.</span><span class="pln">savefig</span><span class="pun">(</span><span class="str">"myImagePDF.pdf"</span><span class="pun">,</span><span class="pln"> format</span><span class="pun">=</span><span class="str">"pdf"</span><span class="pun">,</span><span class="pln"> bbox_inches</span><span class="pun">=</span><span class="str">"tight"</span><span class="pun">)</span><span class="pln">
plt</span><span class="pun">.</span><span class="pln">show</span><span class="pun">()</span>
Output

Updated on: 2023-09-12T03:11:35+05:30
71K+ Views

Advertisements