 Data Structure
 Networking
 RDBMS
RDBMS Operating System
 Java
Java MS Excel
 iOS
iOS HTML
HTML CSS
CSS Android
 Python
 C Programming
 C++
C++ C#
C# MongoDB
 MySQL
MySQL Javascript
 PHP
PHP
- Selected Reading
- UPSC IAS Exams Notes
- Developer's Best Practices
- Questions and Answers
- Effective Resume Writing
- HR Interview Questions
- Computer Glossary
- Who is Who
How to create a Cumulative Histogram in Plotly?
A cumulative histogram is a type of histogram that shows the cumulative distribution function (CDF) of a dataset. The CDF represents the probability that a random observation from the dataset will be less than or equal to a certain value. Cumulative histograms are useful when you want to compare the distribution of two or more datasets or when you want to visualize the proportion of data points that fall below a certain threshold.
Plotly is a Python library for creating interactive and publication-quality visualizations. It is built on top of the D3.js visualization library and provides a wide range of visualization types, including scatter plots, bar charts, and histograms. Plotly also supports interactive features like zooming, panning, and hover-over tooltips.
To create a cumulative histogram in Plotly, you will first need to load your data into a Pandas DataFrame. Once you have your data in a DataFrame, you can use Plotly Express to create a histogram of your data.
Creating a Cumulative Histogram
A cumulative histogram is a type of histogram that shows the cumulative distribution function (CDF) of a dataset. Instead of showing the frequency of data points in each bin, it shows the cumulative frequency of data points up to that bin. This type of histogram can be created by setting the cumulative parameter to True when creating the histogram in Plotly.
Now let's create a few cumulative histograms. Consider the examples shown below.
Example 1: Vertical Cumulative Histogram
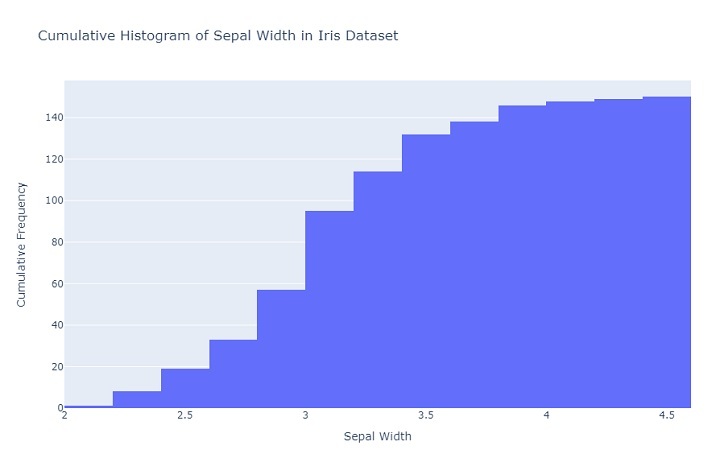
A vertical cumulative histogram is a histogram where the cumulative frequencies are displayed on the y-axis and the variable values are displayed on the X-axis. Consider the code shown below.
import plotly.express as px
import plotly.graph_objects as go

# Load the Iris dataset from Plotly Express
iris_data = px.data.iris()

# Create a new figure with a cumulative histogram
fig = go.Figure(
   data=[go.Histogram(
      x=iris_data['sepal_width'], # Use sepal width as the variable
      cumulative_enabled=True # Enable cumulative mode
   )]
)

# Add labels and titles to the figure
fig.update_layout(
   title='Cumulative Histogram of Sepal Width in Iris Dataset', xaxis_title='Sepal Width', yaxis_title='Cumulative Frequency'
)

# Show the figure
fig.show()
Explanation
Import the Plotly Express and Plotly Graph Objects libraries.
Load the Iris dataset from Plotly Express into a variable called "iris_data".
Create a new figure with a cumulative histogram using the "go.Figure" method.
Set the data for the histogram using the "go.Histogram" method, and specify the variable to plot as the "sepal_width" column in the Iris dataset.
Enable cumulative mode for the histogram by setting "cumulative_enabled" to True.
Add labels and titles to the figure using the "update_layout" method, specifying the title, x-axis label, and y-axis label.
Show the resulting figure using the "show" method.
Output
Before running the code, make sure you have Plotly on your system. If not, then you can have it installed using the pip package manager.
On executing the code, you will get to see the following plot on your browser ?

Example 2: Horizontal Cumulative Histogram
A horizontal cumulative histogram is a histogram where the cumulative frequencies are displayed on the X-axis and the variable values are displayed on the Y-axis. Consider the code shown below.
import plotly.express as px
import plotly.graph_objects as go

# Load the Iris dataset from Plotly Express
iris_data = px.data.iris()

# Create a new figure with a horizontal cumulative histogram
fig = go.Figure(
   data=[go.Histogram(
      y=iris_data['sepal_width'], # Use sepal width as the variable
      cumulative_enabled=True, # Enable cumulative mode
      orientation='h' # Set orientation to horizontal
   )]
)

# Add labels and titles to the figure
fig.update_layout(
   title='Horizontal Cumulative Histogram of Sepal Width in Iris Dataset',
   xaxis_title='Cumulative Frequency',
   yaxis_title='Sepal Width'
)

# Show the figure
fig.show()
Explanation
Import the Plotly Express and Plotly Graph Objects libraries.
Load the Iris dataset from Plotly Express into a variable called "iris_data".
Create a new figure with a horizontal cumulative histogram using the "go.Figure" method.
Set the data for the histogram using the "go.Histogram" method, and specify the variable to plot as the "sepal_width" column in the Iris dataset.
Enable cumulative mode for the histogram by setting "cumulative_enabled" to True.
Set the orientation of the histogram to horizontal by setting "orientation" to 'h'.
Add labels and titles to the figure using the "update_layout" method, specifying the title, x-axis label, and y-axis label.
Show the resulting figure using the "show" method.
Output
On executing the code, you will get to see the following plot on your browser ?

Conclusion
In conclusion, creating a cumulative histogram in Plotly is a straightforward process. It involves enabling the cumulative mode for a histogram using the "cumulative_enabled" parameter and specifying the variable to plot. Plotly provides various customization options, such as setting the orientation, adding labels and titles to the figure, and adjusting the appearance of the histogram. With its interactive and dynamic features, Plotly is an excellent tool for creating informative and visually appealing cumulative histograms.

