 Data Structure
 Networking
 RDBMS
RDBMS Operating System
 Java
Java MS Excel
 iOS
iOS HTML
HTML CSS
CSS Android
 Python
 C Programming
 C++
C++ C#
C# MongoDB
 MySQL
MySQL Javascript
 PHP
PHP
- Selected Reading
- UPSC IAS Exams Notes
- Developer's Best Practices
- Questions and Answers
- Effective Resume Writing
- HR Interview Questions
- Computer Glossary
- Who is Who
How to Create a Poisson Probability Mass Function Plot in Python?
The Poisson distribution is a probability distribution that models the occurrence of events in a fixed time or space interval, given the average rate of occurrence. It is commonly used in fields such as physics, engineering, and economics to model the arrival of particles, failures of components, or customer arrivals.
One way to visualise the Poisson distribution is to plot its probability mass function (PMF), which shows the probability of each possible number of events occurring in a given interval. In Python, we can use the SciPy library to generate the PMF of a Poisson distribution and then use Matplotlib to plot it.
In this article, we will explore how to create a Poisson PMF plot in Python using SciPy and Matplotlib. We will generate the PMF for different values of the Poisson parameter and visualise the results using a bar plot.
Now let's discuss the different approaches that are made available to us that we can make use of to create a poisson probability mass function.
Using the Scipy library: Scipy is a popular scientific computing library that includes functions for generating and visualising probability distributions.
Using NumPy and Matplotlib: NumPy is a library for scientific computing in Python, which includes functions for generating arrays of random numbers.
In this article we will discuss both these approaches with the help of examples.
Using scipy library
Consider the code shown below.
Example
import numpy as np
from scipy.stats import poisson
import matplotlib.pyplot as plt

# Set the Poisson parameter and the range of k values
lam = 2
k_values = np.arange(0, 11)

# Calculate the PMF using the Scipy library
pmf_values = poisson.pmf(k_values, lam)

# Plot the PMF using Matplotlib
plt.plot(k_values, pmf_values, 'bo-', linewidth=2)
plt.xlabel('Number of events')
plt.ylabel('Probability')
plt.title('Poisson PMF (lambda=2)')
plt.grid(True)
plt.show()
Explanation
We start by importing the necessary libraries: NumPy, Scipy, and Matplotlib.
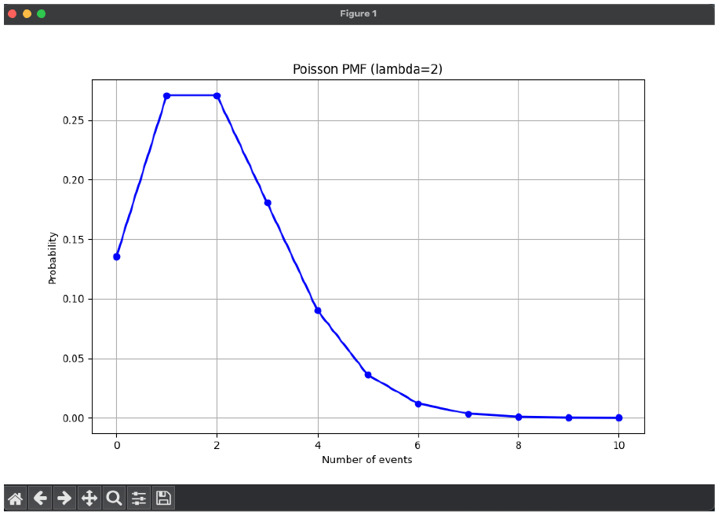
We set the Poisson parameter lambda to 2, which defines the rate at which events occur in the Poisson distribution.
We define the range of k values from 0 to 10, which represent the number of events.
We use the poisson.pmf() function from the Scipy library to calculate the PMF values for the given lambda and k values.
We plot the PMF values using the plt.plot() function from Matplotlib, with blue circles ('bo-') as markers and a line width of 2. We also add labels for the x?axis, y?axis, and title of the plot, as well as a grid to aid visualisation.
Finally, we use the plt.show() function to display the plot.
To run the code shown below, we first need to install scipy library and for that we can run the command shown below.
Command
pip3 install scipy
Now run the command shown below.
python3 main.py
Output

Using numPy and Matplotlib
Consider the code shown below.
Example
import numpy as np
import matplotlib.pyplot as plt
from scipy.stats import poisson

# Define the Poisson distribution parameter lambda
lam = 3

# Create an array of x values
x = np.arange(0, 15).tolist()

# Create the Poisson probability mass function
pmf = poisson.pmf(x, lam)

# Create the plot
plt.plot(x, pmf, 'bo', ms=8)
plt.vlines(x, 0, pmf, colors='b', lw=5)
plt.title('Poisson Probability Mass Function')
plt.xlabel('Number of events')
plt.ylabel('Probability')
plt.show()
Explanation
The code starts by importing necessary libraries, including NumPy and Matplotlib.
A lambda function is defined to calculate the probability mass function for Poisson distribution.
The values for lambda and the range of k values are set.
The probability mass function is calculated using the lambda value and k range using the previously defined lambda function.
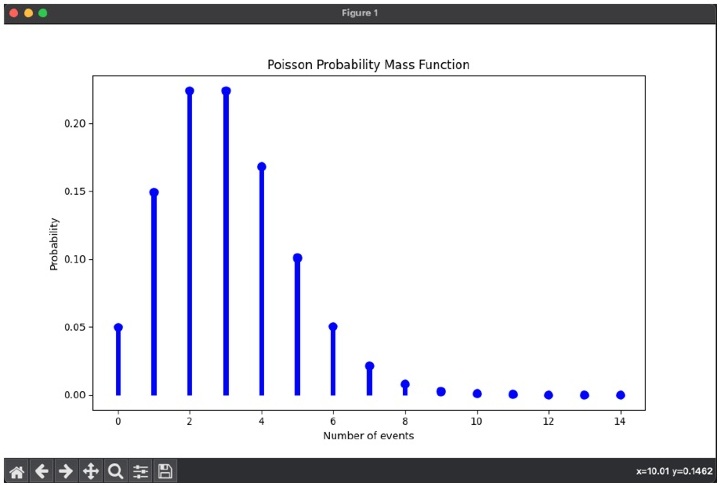
A line plot is created using the k and probability values using the Matplotlib library.
The x and y axis labels are set, and the title is defined for the plot.
The show() method is called to display the plot.
Output

Conclusion
In conclusion, a Poisson Probability Mass Function (PMF) plot is a useful visualisation tool for understanding the probability distribution of events that occur randomly in time or space. This article provided two approaches to create a Poisson PMF plot in Python.
The first approach made use of the scipy library, while the second approach used the NumPy and Matplotlib libraries. Both approaches involve defining the Poisson distribution parameters, calculating the probability mass function, and plotting the function using the appropriate library. The choice of approach depends on the user's familiarity with the libraries and specific use case requirements.

