- Matplotlib - Home
- Matplotlib - Introduction
- Matplotlib - Vs Seaborn
- Matplotlib - Environment Setup
- Matplotlib - Anaconda distribution
- Matplotlib - Jupyter Notebook
- Matplotlib - Pyplot API
- Matplotlib - Simple Plot
- Matplotlib - Saving Figures
- Matplotlib - Markers
- Matplotlib - Figures
- Matplotlib - Styles
- Matplotlib - Legends
- Matplotlib - Colors
- Matplotlib - Colormaps
- Matplotlib - Colormap Normalization
- Matplotlib - Choosing Colormaps
- Matplotlib - Colorbars
- Matplotlib - Working With Text
- Matplotlib - Text properties
- Matplotlib - Subplot Titles
- Matplotlib - Images
- Matplotlib - Image Masking
- Matplotlib - Annotations
- Matplotlib - Arrows
- Matplotlib - Fonts
- Matplotlib - Font Indexing
- Matplotlib - Font Properties
- Matplotlib - Scales
- Matplotlib - LaTeX
- Matplotlib - LaTeX Text Formatting in Annotations
- Matplotlib - PostScript
- Matplotlib - Mathematical Expressions
- Matplotlib - Animations
- Matplotlib - Celluloid Library
- Matplotlib - Blitting
- Matplotlib - Toolkits
- Matplotlib - Artists
- Matplotlib - Styling with Cycler
- Matplotlib - Paths
- Matplotlib - Path Effects
- Matplotlib - Transforms
- Matplotlib - Ticks and Tick Labels
- Matplotlib - Radian Ticks
- Matplotlib - Dateticks
- Matplotlib - Tick Formatters
- Matplotlib - Tick Locators
- Matplotlib - Basic Units
- Matplotlib - Autoscaling
- Matplotlib - Reverse Axes
- Matplotlib - Logarithmic Axes
- Matplotlib - Symlog
- Matplotlib - Unit Handling
- Matplotlib - Ellipse with Units
- Matplotlib - Spines
- Matplotlib - Axis Ranges
- Matplotlib - Axis Scales
- Matplotlib - Axis Ticks
- Matplotlib - Formatting Axes
- Matplotlib - Axes Class
- Matplotlib - Twin Axes
- Matplotlib - Figure Class
- Matplotlib - Multiplots
- Matplotlib - Grids
- Matplotlib - Object-oriented Interface
- Matplotlib - PyLab module
- Matplotlib - Subplots() Function
- Matplotlib - Subplot2grid() Function
- Matplotlib - Anchored Artists
- Matplotlib - Manual Contour
- Matplotlib - Coords Report
- Matplotlib - AGG filter
- Matplotlib - Ribbon Box
- Matplotlib - Fill Spiral
- Matplotlib - Findobj Method
- Matplotlib - Hyperlinks
- Matplotlib - Image Thumbnail
- Matplotlib - Plotting with Keywords
- Matplotlib - Create Logo
- Matplotlib - Multipage PDF
- Matplotlib - Multiprocessing
- Matplotlib - Print Stdout
- Matplotlib - Compound Path
- Matplotlib - Sankey Class
- Matplotlib - MRI with EEG
- Matplotlib - Stylesheets
- Matplotlib - Background Colors
- Matplotlib - Basemap
Matplotlib Events
- Matplotlib - Event Handling
- Matplotlib - Close Event
- Matplotlib - Mouse Move
- Matplotlib - Click Events
- Matplotlib - Scroll Event
- Matplotlib - Keypress Event
- Matplotlib - Pick Event
- Matplotlib - Looking Glass
- Matplotlib - Path Editor
- Matplotlib - Poly Editor
- Matplotlib - Timers
- Matplotlib - Viewlims
- Matplotlib - Zoom Window
Matplotlib Widgets
- Matplotlib - Cursor Widget
- Matplotlib - Annotated Cursor
- Matplotlib - Button Widget
- Matplotlib - Check Buttons
- Matplotlib - Lasso Selector
- Matplotlib - Menu Widget
- Matplotlib - Mouse Cursor
- Matplotlib - Multicursor
- Matplotlib - Polygon Selector
- Matplotlib - Radio Buttons
- Matplotlib - RangeSlider
- Matplotlib - Rectangle Selector
- Matplotlib - Ellipse Selector
- Matplotlib - Slider Widget
- Matplotlib - Span Selector
- Matplotlib - Textbox
Matplotlib Plotting
- Matplotlib - Line Plots
- Matplotlib - Area Plots
- Matplotlib - Bar Graphs
- Matplotlib - Histogram
- Matplotlib - Pie Chart
- Matplotlib - Scatter Plot
- Matplotlib - Box Plot
- Matplotlib - Arrow Demo
- Matplotlib - Fancy Boxes
- Matplotlib - Zorder Demo
- Matplotlib - Hatch Demo
- Matplotlib - Mmh Donuts
- Matplotlib - Ellipse Demo
- Matplotlib - Bezier Curve
- Matplotlib - Bubble Plots
- Matplotlib - Stacked Plots
- Matplotlib - Table Charts
- Matplotlib - Polar Charts
- Matplotlib - Hexagonal bin Plots
- Matplotlib - Violin Plot
- Matplotlib - Event Plot
- Matplotlib - Heatmap
- Matplotlib - Stairs Plots
- Matplotlib - Errorbar
- Matplotlib - Hinton Diagram
- Matplotlib - Contour Plot
- Matplotlib - Wireframe Plots
- Matplotlib - Surface Plots
- Matplotlib - Triangulations
- Matplotlib - Stream plot
- Matplotlib - Ishikawa Diagram
- Matplotlib - 3D Plotting
- Matplotlib - 3D Lines
- Matplotlib - 3D Scatter Plots
- Matplotlib - 3D Contour Plot
- Matplotlib - 3D Bar Plots
- Matplotlib - 3D Wireframe Plot
- Matplotlib - 3D Surface Plot
- Matplotlib - 3D Vignettes
- Matplotlib - 3D Volumes
- Matplotlib - 3D Voxels
- Matplotlib - Time Plots and Signals
- Matplotlib - Filled Plots
- Matplotlib - Step Plots
- Matplotlib - XKCD Style
- Matplotlib - Quiver Plot
- Matplotlib - Stem Plots
- Matplotlib - Visualizing Vectors
- Matplotlib - Audio Visualization
- Matplotlib - Audio Processing
Matplotlib Useful Resources
- Matplotlib - Quick Guide
- Matplotlib - Cheatsheet
- Matplotlib - Useful Resources
- Matplotlib - Discussion
Matplotlib - Wireframe Plots
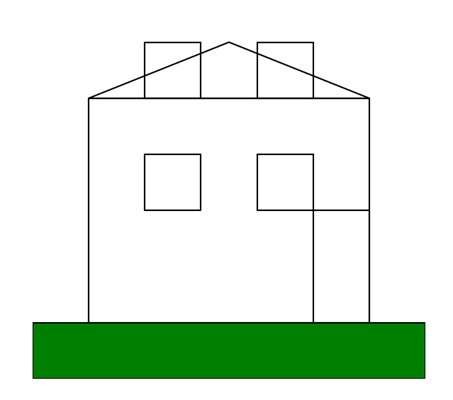
A wireframe plot is a visual representation of a design or structure. It is like the skeleton or outline of something, showing only the essential elements without details. In the context of graphics, a wireframe plot is used to sketch the basic layout and structure of a webpage, app, or other visual project.
Imagine that you are planning to build a new house. A wireframe is used to sketch out where rooms and doors will be placed. In 3D modeling, this is like defining the basic shape of a character before adding details−
Wireframe Plots in Matplotlib
We can create a wireframe plot in Matplotlib using the plot_wireframe() function. This function helps to visualize a three-dimensional wireframe plot that represents a surface using lines connecting data points. This type of plot is commonly used in scientific, engineering, and design applications.
The plot_wireframe() Function
The plot_wireframe() function in Matplotlib takes three sets of data points (X, Y, Z) representing a grid in 3D space and connects them with lines to form the wireframe structure. These data points can represent either a surface or a mathematical function in three dimensions.
Syntax
Following is the syntax of plot_wireframe() function in Matplotlib −
Axes3D.plot_wireframe(X, Y, Z, rstride=1, cstride=1, antialiased=True, *args, **kwargs)
Where,
- X is the x-coordinates of the data points (2D array or meshgrid).
- Y is the y-coordinates of the data points (2D array or meshgrid).
- Z is the z-coordinaes of the data points (2D array or meshgrid).
- rstride is the row stride used for downsampling the wireframe.
- cstride is the column stride used for downsampling the wireframe.
- antialiased is a boolean indicating whether to use antialiased rendering.
- *args and **kwargs are the additional keyword arguments for customization (e.g., colors, linestyles).
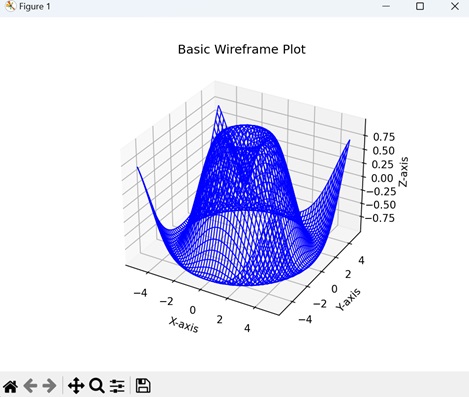
Example - Basic Wireframe Plot
Imagine a 3D landscape where the elevation is represented by a mathematical function. A basic wireframe plot shows the contours or outlines of this landscape using a mesh of lines, allowing you to observe how the landscape changes in different directions.
In the following example, we are creating a simple 3D wireframe plot for the sine function over a specified 2D grid −
import matplotlib.pyplot as plt
import numpy as np

# Generating data
x = np.linspace(-5, 5, 50)
y = np.linspace(-5, 5, 50)
X, Y = np.meshgrid(x, y)
Z = np.sin(np.sqrt(X**2 + Y**2))

# Creating a basic wireframe plot
fig = plt.figure()
ax = fig.add_subplot(111, projection='3d')
ax.plot_wireframe(X, Y, Z, color='blue', linewidth=1)

ax.set_title('Basic Wireframe Plot')
ax.set_xlabel('X-axis')
ax.set_ylabel('Y-axis')
ax.set_zlabel('Z-axis')

plt.show()
Output
After executing the above code, we get the following output −
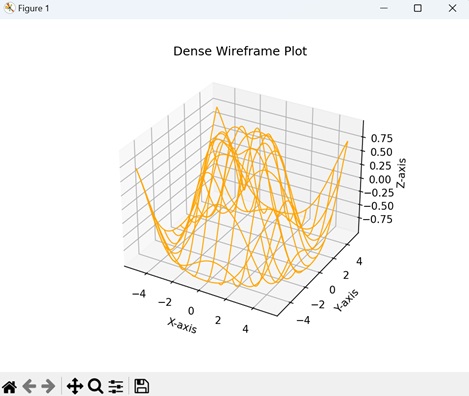
Example - Wireframe Plot with Increased Density
A wireframe plot with increased density in Matplotlib refers to a three-dimensional visualization where the density of lines connecting the data points in the wireframe is increased, resulting in a more detailed representation of the underlying surface.
In here, we are creating a 3D wireframe plot for the sine function, but with increased density specified by the 'rstride' and 'cstride' parameters in the plot_wireframe() function −
import matplotlib.pyplot as plt
import numpy as np

# Generating data
x = np.linspace(-5, 5, 100)
y = np.linspace(-5, 5, 100)
X, Y = np.meshgrid(x, y)
Z = np.sin(np.sqrt(X**2 + Y**2))

# Creating a wireframe plot with increased density
fig = plt.figure()
ax = fig.add_subplot(111, projection='3d')
ax.plot_wireframe(X, Y, Z, rstride=10, cstride=10, color='orange', linewidth=1)

ax.set_title('Dense Wireframe Plot')
ax.set_xlabel('X-axis')
ax.set_ylabel('Y-axis')
ax.set_zlabel('Z-axis')

plt.show()
Output
Following is the output of the above code −
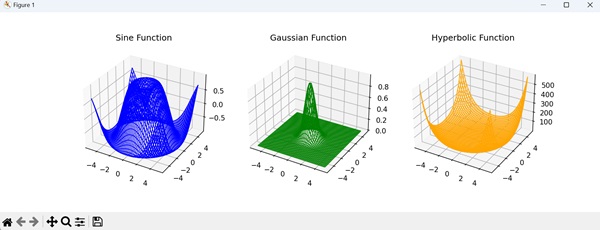
Example - Multiple Wireframe Plots
Multiple wireframe plots in Matplotlib refer to creating a single figure containing subplots, each displaying a distinct three-dimensional (3D) wireframe representation. This approach allows you to compare and visualize different aspects of your data in a structured manner.
Now, we are creating three wireframe plots, each representing a different mathematical function (sine, Gaussian, and hyperbolic). The add_subplot() function is used to create subplots, and the plot_wireframe() function is used to generate wireframe plots for each subplot −
import matplotlib.pyplot as plt
import numpy as np

# Generating data
x = np.linspace(-5, 5, 50)
y = np.linspace(-5, 5, 50)
X, Y = np.meshgrid(x, y)

# Sine function
Z1 = np.sin(np.sqrt(X**2 + Y**2))

# Gaussian function
Z2 = np.exp(-(X**2 + Y**2))

# Hyperbolic function
Z3 = np.sinh(np.sqrt(X**2 + Y**2))

# Creating subplots with multiple wireframe plots
fig = plt.figure(figsize=(12, 4))

# Subplot 1: Sine function
ax1 = fig.add_subplot(131, projection='3d')
ax1.plot_wireframe(X, Y, Z1, color='blue', linewidth=1)
ax1.set_title('Sine Function')

# Subplot 2: Gaussian function
ax2 = fig.add_subplot(132, projection='3d')
ax2.plot_wireframe(X, Y, Z2, color='green', linewidth=1)
ax2.set_title('Gaussian Function')

# Subplot 3: Hyperbolic function
ax3 = fig.add_subplot(133, projection='3d')
ax3.plot_wireframe(X, Y, Z3, color='orange', linewidth=1)
ax3.set_title('Hyperbolic Function')

plt.show()
Output
Output of the above code is as follows −
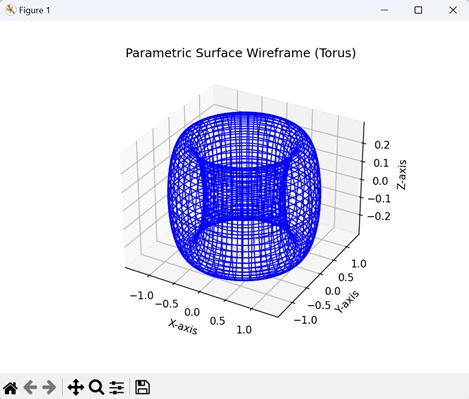
Example - Parametric Surface Wireframe Plot
A parametric surface wireframe plot in Matplotlib is a three-dimensional visualization that represents a surface using parametric equations. Parametric equations define the coordinates of points on the surface in terms of one or more parameters, allowing for a wide range of complex and dynamic shapes to be visualized.
In the example below, we are defining parametric equations for a torus in the "torus_parametric" function. We then generate parameter values, create a meshgrid from these parameters, and compute 3D coordinates using the parametric equations. Finally, we create a wireframe plot of the torus using the plot_wireframe() function −
import matplotlib.pyplot as plt
import numpy as np
from mpl_toolkits.mplot3d import Axes3D

# Parametric equations for a torus
def torus_parametric(u, v, R=1, r=0.3):
    x = (R + r * np.cos(v)) * np.cos(u)
    y = (R + r * np.cos(v)) * np.sin(u)
    z = r * np.sin(v)
    return x, y, z

# Generating parameter values
u_values = np.linspace(0, 2 * np.pi, 100)
v_values = np.linspace(0, 2 * np.pi, 100)

# Creating a meshgrid from parameter values
U, V = np.meshgrid(u_values, v_values)

# Providing coordinates using parametric equations
X, Y, Z = torus_parametric(U, V)

# Creating a parametric surface wireframe plot
fig = plt.figure()
ax = fig.add_subplot(111, projection='3d')
ax.plot_wireframe(X, Y, Z, color='blue', linewidth=1)

ax.set_title('Parametric Surface Wireframe (Torus)')
ax.set_xlabel('X-axis')
ax.set_ylabel('Y-axis')
ax.set_zlabel('Z-axis')

plt.show()
Output
The output obtained is as shown below −