
Article Categories
- All Categories
-
 Data Structure
-
 Networking
-
 RDBMS
RDBMS
-
 Operating System
-
 Java
Java
-
 MS Excel
-
 iOS
iOS
-
 HTML
HTML
-
 CSS
CSS
-
 Android
-
 Python
-
 C Programming
-
 C++
C++
-
 C#
C#
-
 MongoDB
-
 MySQL
MySQL
-
 Javascript
-
 PHP
PHP
-
 Economics & Finance
Selected Reading
How to create a point chart with point size increment based on the position of the point in R?
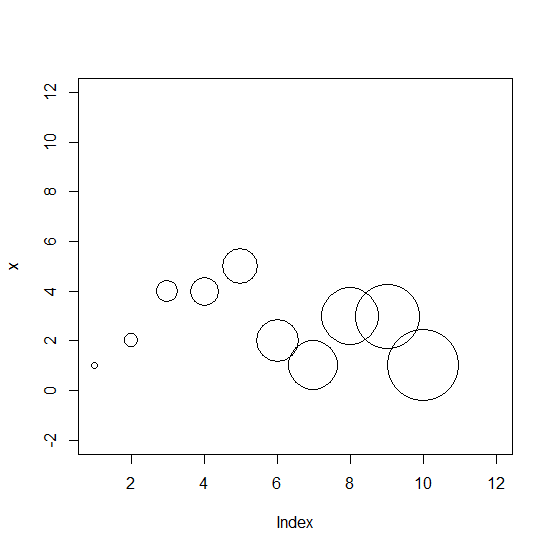
The cex argument is used to increase or decrease the point size in a point chart created in base R. If we want to create a point chart with points of size in increment manner then we can pass a vector of the same size as the vector for which we want to create the point chart. For example, if we have a vector x that contains 10 elements then cex will be set as cex=1:10.
Example1
> x<-rpois(10,2)
> plot(x,cex=1:10,xlim=c(1,12),ylim=c(-2,12))
Output:
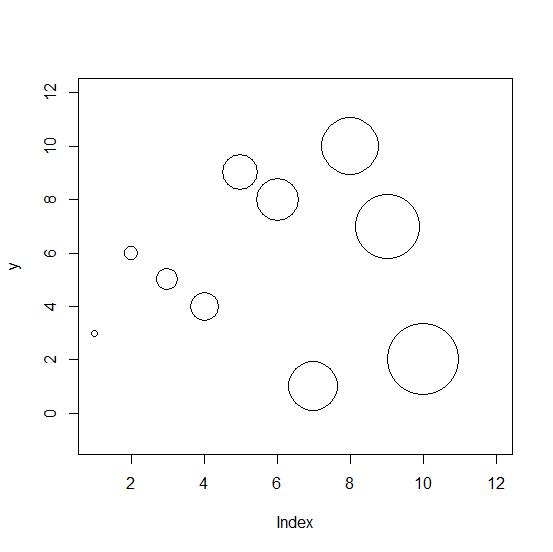
Example
Let’s have a look at another example:
> y<-sample(1:10,10)
> plot(y,cex=1:10,xlim=c(1,12),ylim=c(-1,12))
Output:

Updated on: 2026-03-11T22:50:53+05:30
361 Views

Advertisements