
Article Categories
- All Categories
-
 Data Structure
-
 Networking
-
 RDBMS
RDBMS
-
 Operating System
-
 Java
Java
-
 MS Excel
-
 iOS
iOS
-
 HTML
HTML
-
 CSS
CSS
-
 Android
-
 Python
-
 C Programming
-
 C++
C++
-
 C#
C#
-
 MongoDB
-
 MySQL
MySQL
-
 Javascript
-
 PHP
PHP
-
 Economics & Finance
Selected Reading
How to assign a value to a base R plot?
To assign a value to a base R plot, we can follow the below steps −
First of all, create a vector and its histogram then record it with recordPlot function in an object.
Then, use dev.off function to remove the plot.
After that, read the plot with object name.
Create the vector and histogram then save it in an object
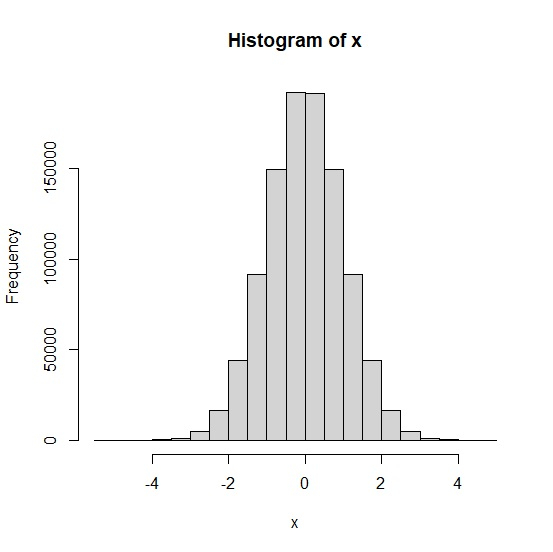
Let’s create a vector of normal distribution and create its histogram then save it in an object called Histogram using recordPlot as shown below −
x<-rnorm(1000000)
hist(x)
Histogram=recordPlot()
On executing, the above script generates the below output(this output will vary on your system due to randomization) −
Output
Remove the plot from plot window
Using dev.off function to remove the plot from plot window −
x<-rnorm(1000000)
hist(x)
Histogram=recordPlot()
dev.off()
Output
null device
1
Create the histogram again
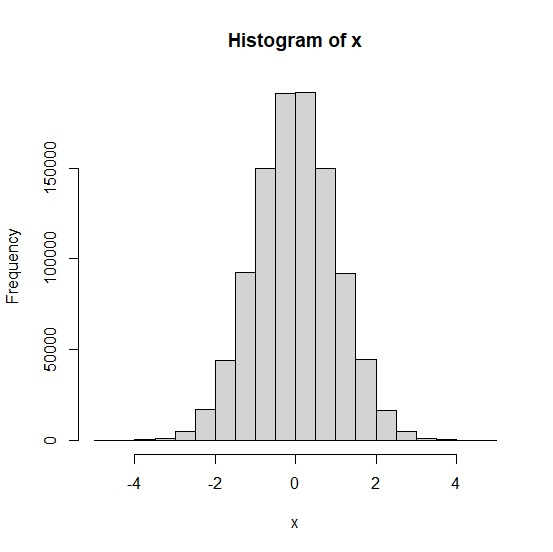
Now we can call Histogram to create the histogram −
x<-rnorm(1000000)
hist(x)
Histogram=recordPlot()
Histogram
Output

Updated on: 2026-03-11T22:50:58+05:30
556 Views

Advertisements