
Article Categories
- All Categories
-
 Data Structure
-
 Networking
-
 RDBMS
RDBMS
-
 Operating System
-
 Java
Java
-
 MS Excel
-
 iOS
iOS
-
 HTML
HTML
-
 CSS
CSS
-
 Android
-
 Python
-
 C Programming
-
 C++
C++
-
 C#
C#
-
 MongoDB
-
 MySQL
MySQL
-
 Javascript
-
 PHP
PHP
-
 Economics & Finance
Selected Reading
How to deal with error invalid xlim value in base R plot?
The error invalid xlim value occurs when we incorrectly provide the xlim values, these values are not used in sequence, we just need to provide first and the last value. For Example, if we want to create a point chart of 1 to 5 with xlim having values between -5 to 15 then we can use the command as follows −
plot(1:5,xlim=c(-5:15))
Example
Add the following code to the above command −
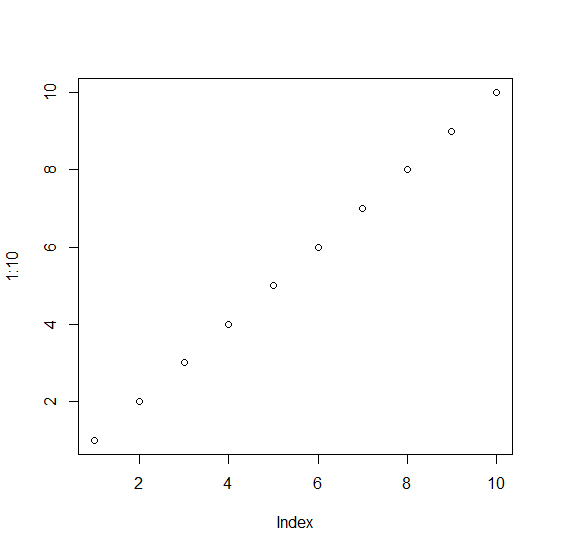
plot(1:10)
Output
If you execute the above given command, it generates the following Output −
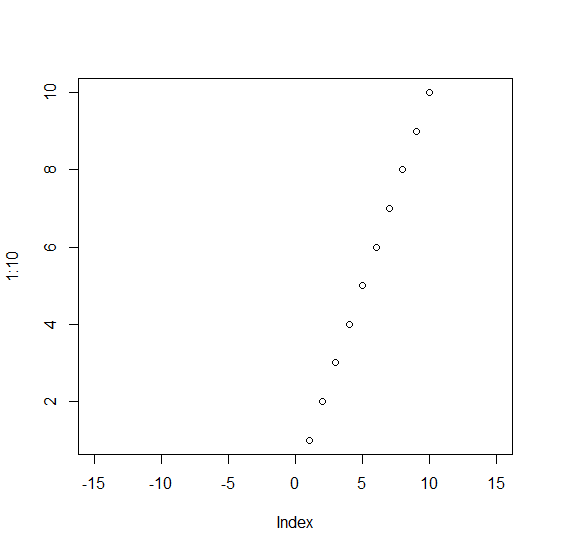
Add the following code to the above snippet −
plot(1:10)
plot(1:10,xlim=c(-15:15))
Error in plot.window(...) : invalid 'xlim' value

Correct:

plot(1:10,xlim=c(-15,15))
Output
If you execute all the above given snippets as a single program, it generates the following Output −

Updated on: 2021-11-02T07:32:58+05:30
4K+ Views

Advertisements