 Data Structure
 Networking
 RDBMS
RDBMS Operating System
 Java
Java MS Excel
 iOS
iOS HTML
HTML CSS
CSS Android
 Python
 C Programming
 C++
C++ C#
C# MongoDB
 MySQL
MySQL Javascript
 PHP
PHP
- Selected Reading
- UPSC IAS Exams Notes
- Developer's Best Practices
- Questions and Answers
- Effective Resume Writing
- HR Interview Questions
- Computer Glossary
- Who is Who
How data manipulate in Seaborn done to create the plots?
In Seaborn, data manipulation is done using pandas, which is a popular data manipulation library in Python. Seaborn is built on top of pandas and integrates seamlessly with it. Pandas provides powerful data structures and functions for data manipulation, such as filtering, grouping, aggregating, and transforming data, which can be used in conjunction with Seaborn to create plots.
By combining the data manipulation capabilities of pandas with the plotting functions of Seaborn, we can easily manipulate and visualize our data in a concise and efficient manner. This allows us to explore and communicate insights effectively from our dataset.
Here's a step-by-step guide on how data manipulation is done using the Pandas library in Seaborn to create plots.
Import the necessary libraries
As we are working with the pandas and Seaborn libraries, first we have to import those two libraries with the below code.
import seaborn as sns
import pandas as pd
Load or create your dataset using pandas
Next we can load or create our own dataset by using the read_csv and DataFrame of the pandas library. In this article we are creating the dataset by using the DataFrame() function of the pandas library.
Example
import seaborn as sns
import pandas as pd

data = {'Name': ['Alice', 'Bob', 'Charlie'],
         'Age': [25, 30, 35],
         'Salary': [50000, 60000, 70000]}
df = pd.DataFrame(data)
print(df.head())
Output
      Name  Age  Salary
0    Alice   25   50000
1      Bob   30   60000
2  Charlie   35   70000
Perform data manipulation operations
Once we have our dataset in a pandas DataFrame, now we can use various data manipulation techniques to prepare the data for plotting. Some of the common operations are as mentioned as below.
Filtering
Filtering is used to select a subset of rows or columns based on certain conditions. For example, from the created data if we want to filter the rows which has the age greater than 30 then the code will be defined as follows.
Example
import seaborn as sns
import pandas as pd

data = {'Name': ['Alice', 'Bob', 'Charlie'],
         'Age': [25, 30, 35],
         'Salary': [50000, 60000, 70000]}
df = pd.DataFrame(data)
df.head()

filtered_df = df[df['Age'] > 30]
res = filtered_df.head()
print(res)
Output
      Name  Age  Salary
2  Charlie   35   70000
Grouping and Aggregating
Grouping the data based on one or more variables and calculating summary statistics. For example, when we want to group data by Name and calculate the average Salary then the below line of code will be used.
Example
import seaborn as sns
import pandas as pd
data = {'Name': ['Alice', 'Bob', 'Charlie'],
         'Age': [25, 30, 35],
         'Salary': [50000, 60000, 70000]}
df = pd.DataFrame(data)
grouped_df = df.groupby('Name')['Salary'].mean()
print(grouped_df.head())
Output
Name
Alice      50000.0
Bob        60000.0
Charlie    70000.0
Name: Salary, dtype: float64
Data Transformation
Data transformation means applying functions or transformations to modify the data and to create a new column based on the existing columns.
Example
import seaborn as sns
import pandas as pd

data = {'Name': ['Alice', 'Bob', 'Charlie'],
         'Age': [25, 30, 35],
         'Salary': [50000, 60000, 70000]}
df = pd.DataFrame(data)
df.head()

grouped_df = df.groupby('Name')['Salary'].mean()
res = grouped_df.head()
print(res)
Output
Name
Alice      50000.0
Bob        60000.0
Charlie    70000.0
Name: Salary, dtype: float64
Data Reshaping
In data reshaping we are restructuring the data to a different format using techniques like pivoting or melting.
Example
import seaborn as sns
import pandas as pd
data = {'Name': ['Alice', 'Bob', 'Charlie'],
         'Age': [25, 30, 35],
         'Salary': [50000, 60000, 70000]}
df = pd.DataFrame(data)
pivoted_df = df.pivot(index='Name', columns='Age', values='Salary')
print(pivoted_df.head())
Output
Age           25       30       35
Name
Alice    50000.0      NaN      NaN
Bob          NaN  60000.0      NaN
Charlie      NaN      NaN  70000.0
Use Seaborn to create plots
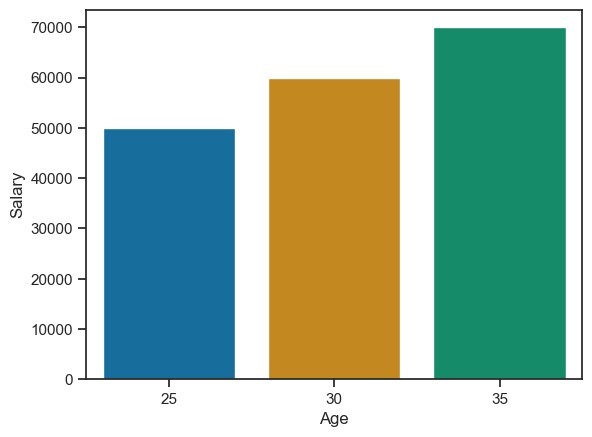
Once the data is prepared, we can use Seaborn's plotting functions to create visualizations based on our data. For example, when we want to create a bar plot of average salary by age group then
Example
import seaborn as sns
import pandas as pd
import matplotlib.pyplot as plt

data = {'Name': ['Alice', 'Bob', 'Charlie'],
         'Age': [25, 30, 35],
         'Salary': [50000, 60000, 70000]}
df = pd.DataFrame(data)
sns.barplot(x='Age', y='Salary', data=df)
plt.show()
Output

Seaborn provides a wide range of plotting functions, including scatter plots, line plots, bar plots, histogram, box plots, and many more. These functions accept pandas DataFrames as input and provide options to customize the appearance and styling of the plots.

