 Data Structure
 Networking
 RDBMS
RDBMS Operating System
 Java
Java MS Excel
 iOS
iOS HTML
HTML CSS
CSS Android
 Python
 C Programming
 C++
C++ C#
C# MongoDB
 MySQL
MySQL Javascript
 PHP
PHP
- Selected Reading
- UPSC IAS Exams Notes
- Developer's Best Practices
- Questions and Answers
- Effective Resume Writing
- HR Interview Questions
- Computer Glossary
- Who is Who
How to Create an Area Chart in Seaborn?
An Area Chart is like a magician's hat of data visualization - it pulls out information about the cumulative magnitude of different variables over time or any other ordered dimension. You can see the magic happen as the chart unfolds, showing you the total magnitude of the variables in the form of stacked area plots. Each line represents a variable, and the area under it represents its magnitude at each point in time. With this chart, it's easy to compare the relative contributions of each variable to the total magnitude at any given time.
If you want to dive into the magic of data visualization, Seaborn is the perfect Python library. It provides a simple and intuitive interface for creating Area Charts and other data visualizations. With Seaborn's Area Charts, you can customize the chart to fit your needs and visualize a wide range of data from various domains. So why not add some magic to your data with an Area Chart?
Syntax
Users can follow the syntax below to use the Seaborn to create an area chart.
sns.lineplot(x="year", y="passengers", data=flights_data, estimator="sum", ci=None, color="green", style="dotted")
plt.show()
In the above syntax, we have used the lineplot() method of the Seaborn library to create an area chart.
Customizations Used for the area Chart
Some of the most commonly used customizations include ?
Changing the color of the lines ? You can use the `color` parameter to specify the color of the lines in your chart. For example, `color="green"` will set the color of the lines to green.
Changing the style of the lines ? You can use the `style` parameter to specify the style of the lines in your chart. For example, `style="dotted"` will set the style of the lines to dotted.
Adding a legend ? You can use the `legend` parameter to add a legend to your chart. For example, `legend="brief"` will add a brief legend to the chart.
Adding labels to the axes ? You can use the `xlabel` and `ylabel` parameters to add labels to your chart's x and y axes. For example, `xlabel="Year"` will add a label to the chart's x-axis that says "Year".
Example 1
Here is an example of a basic area chart in Seaborn ?
import pandas as pd
import matplotlib.pyplot as plt
import seaborn as sns

#set seaborn style
sns.set_theme()

#define DataFrame
df = pd.DataFrame({'period': [1, 2, 3, 4, 5, 6, 7, 8],
                   'team_A': [20, 12, 15, 14, 19, 23, 25, 29],
                   'team_B': [5, 7, 7, 9, 12, 9, 9, 4],
                   'team_C': [11, 8, 10, 6, 6, 5, 9, 12]})

#create area chart
plt.stackplot(df.period, df.team_A, df.team_B, df.team_C)
This Python code uses the Pandas, Matplotlib, and Seaborn libraries to create an area chart showing three teams' performance over time. A DataFrame is defined with the required data, and the plt.stackplot() function is used to create the chart. Seaborn is used to setting the chart style.
Output

Example 2
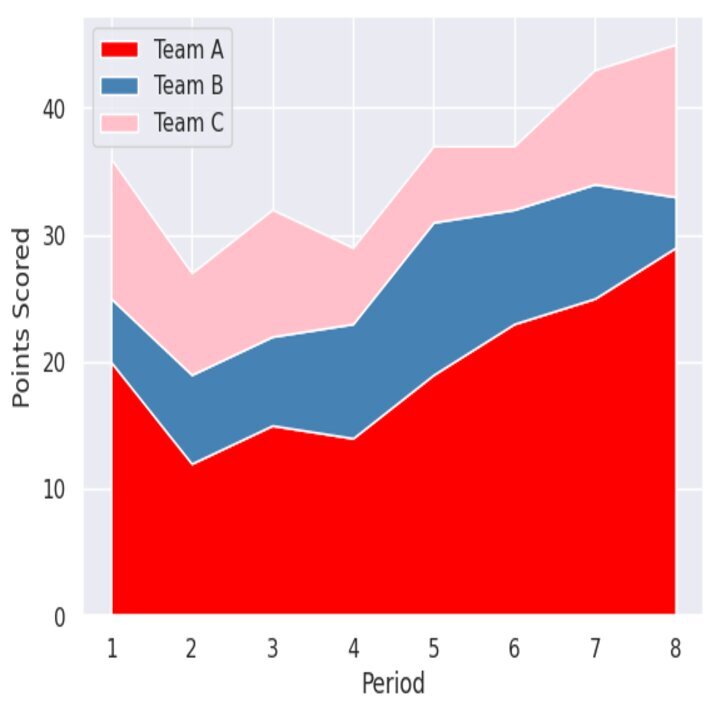
Here is an example of a custom area chart in Seaborn, along with a legend having specific labels ?
import pandas as pd
import matplotlib.pyplot as plt
import seaborn as sns

#set seaborn style
sns.set_theme()

#define DataFrame
df = pd.DataFrame({'period': [1, 2, 3, 4, 5, 6, 7, 8],
                   'team_A': [20, 12, 15, 14, 19, 23, 25, 29],
                   'team_B': [5, 7, 7, 9, 12, 9, 9, 4],
                   'team_C': [11, 8, 10, 6, 6, 5, 9, 12]})

#define colors to use in chart
color_map = ['red', 'steelblue', 'pink']

#create area chart
plt.stackplot(df.period, df.team_A, df.team_B, df.team_C,
              labels=['Team A', 'Team B', 'Team C'],
              colors=color_map)

#add legend
plt.legend(loc='upper left')

#add axis labels
plt.xlabel('Period')
plt.ylabel('Points Scored')

#display area chart
plt.show()
This code creates an area chart using Matplotlib and Seaborn libraries in Python. A DataFrame containing points scored by three teams across eight periods is defined, and the Seaborn style is set. A stackplot function creates the area chart, adding legend and axis labels, and the chart is then displayed.
Output

Conclusion
If you want to dive into the magic of data visualization, Seaborn is the perfect Python library. It provides a simple and intuitive interface for creating Area Charts and other data visualizations. With Seaborn's Area Charts, you can customize the chart to fit your needs and visualize a wide range of data from various domains. So why not add some magic to your data with an Area Chart?

