 Data Structure
 Networking
 RDBMS
RDBMS Operating System
 Java
Java MS Excel
 iOS
iOS HTML
HTML CSS
CSS Android
 Python
 C Programming
 C++
C++ C#
C# MongoDB
 MySQL
MySQL Javascript
 PHP
PHP
- Selected Reading
- UPSC IAS Exams Notes
- Developer's Best Practices
- Questions and Answers
- Effective Resume Writing
- HR Interview Questions
- Computer Glossary
- Who is Who
How to handle missing data using seaborn?
Seaborn is primarily a visualization library and does not provide direct methods to handle missing data. However, Seaborn works seamlessly with pandas, which is a popular data manipulation library in Python and it provides powerful tools to handle missing data, and we can then use Seaborn to visualize the cleaned data.
By combining the data manipulation capabilities of pandas for handling missing data with the visualization capabilities of Seaborn, we can clean our data and create meaningful visualizations to gain insights from our dataset.
Here's a step-by-step guide on how to handle missing data using pandas and visualize the cleaned data using Seaborn
Import the necessary libraries
Firstly, we have to import all the required libraries in our python working environment.
import seaborn as sns
import pandas as pd
Load/create dataset into a pandas DataFrame
Now we can create the dataset by using the DataFrame() function or we can load the dataset by using the read_csv() function of the pandas library. In this article we are creating our own dataset by using the DataFrame() function.
Example
import seaborn as sns
import pandas as pd

data = {'Name': ['Alice', 'Bob', 'Charlie'],
         'Age': [25, 30, 35],
         'Salary': [50000, 60000, 70000]}
df = pd.DataFrame(data)
res = df.head()

print(res)
Output
      Name  Age  Salary
0    Alice   25   50000
1      Bob   30   60000
2  Charlie   35   70000
Identify missing data
Pandas provides methods to identify missing data in a DataFrame. The ?isnull()' function returns a DataFrame of the same shape as the input, with ?True' values where the data is missing and 'False' values where the data is present.
As there are no missing values in our dataset False will be represented in all the rows of the dataset.
Example
import seaborn as sns
import pandas as pd

data = {'Name': ['Alice', 'Bob', 'Charlie'],
         'Age': [25, 30, 35],
         'Salary': [50000, 60000, 70000]}
df = pd.DataFrame(data)
missing_data = df.isnull()
res = missing_data.head()

print(res)
We can also use other methods like 'info()' or 'describe()' to get a summary of missing data in the DataFrame.
Output
    Name    Age  Salary
0  False  False   False
1  False  False   False
2  False  False   False
Handle missing data
Once we have identified the missing data, we can choose how to handle it based on our data and the analysis we want to perform. Some common approaches for handling missing data are as follows.
Removing missing data
If the missing data is relatively small and doesn't affect the overall analysis, we can remove the rows or columns containing missing data using the 'dropna()' method.
Example
import seaborn as sns
import pandas as pd
data = {'Name': ['Alice', 'Bob', 'Charlie'],
         'Age': [25, 30, 35],
         'Salary': [50000, 60000, 70000]}
df = pd.DataFrame(data)
missing_data = df.isnull()
res = missing_data.head()
df_cleaned = df.dropna() #this drops the rows
df_cleaned = df.dropna(axis=1) #this drops the columns
Imputing missing data
If the missing data is significant and removing it would result in a loss of valuable information, we can impute or fill in the missing values with sensible estimates. Pandas provides various imputation methods, such as using mean, median, mode, or custom values.
Example
import seaborn as sns
import pandas as pd
data = {'Name': ['Alice', 'Bob', 'Charlie'],
         'Age': [25, 30, 35],
         'Salary': [50000, 60000, 70000]}
df = pd.DataFrame(data)
missing_data = df.isnull()
res = missing_data.head()
df_cleaned = df.dropna() #this drops the rows
df_cleaned = df.dropna(axis=1) #this drops the columns
# Impute missing values with mean
df['Age'].fillna(df['Age'].mean(), inplace=True)
# Impute missing values with custom value
df['Age'].fillna('N/A', inplace=True)
print(df.head())
Output
      Name  Age  Salary
0    Alice   25   50000
1      Bob   30   60000
2  Charlie   35   70000
There are more advanced imputation techniques available in libraries like scikit-learn, which we can use in conjunction with pandas to handle missing data.
Visualize the cleaned data using Seaborn
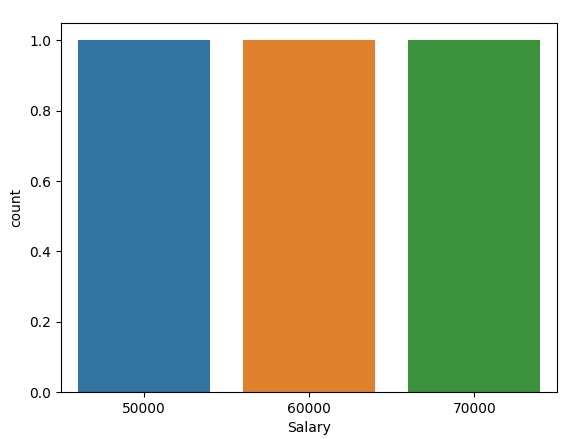
Once we have handled the missing data, we can use Seaborn to visualize the cleaned data. Seaborn provides a wide range of plotting functions that accept pandas DataFrames as input. For example, when we want to create a bar plot of a categorical variable after handling missing data then the below line of code can be used.
Example
import seaborn as sns
import pandas as pd
import matplotlib.pyplot as plt

data = {'Name': ['Alice', 'Bob', 'Charlie'],
         'Age': [25, 30, 35],
         'Salary': [50000, 60000, 70000]}
df = pd.DataFrame(data)
missing_data = df.isnull()
res = missing_data.head()
df_cleaned = df.dropna() #this drops the rows
df_cleaned = df.dropna(axis=1) #this drops the columns
# Impute missing values with mean
df['Age'].fillna(df['Age'].mean(), inplace=True)
# Impute missing values with custom value
df['Age'].fillna('N/A', inplace=True)
print(df.head())

sns.countplot(x='Salary', data=df_cleaned)
plt.show()
Output

We can use various Seaborn plotting functions to explore and visualize our cleaned data, allowing us to gain insights and communicate our findings effectively.

