 Data Structure
 Networking
 RDBMS
RDBMS Operating System
 Java
Java MS Excel
 iOS
iOS HTML
HTML CSS
CSS Android
 Python
 C Programming
 C++
C++ C#
C# MongoDB
 MySQL
MySQL Javascript
 PHP
PHP
- Selected Reading
- UPSC IAS Exams Notes
- Developer's Best Practices
- Questions and Answers
- Effective Resume Writing
- HR Interview Questions
- Computer Glossary
- Who is Who
How to create a seaborn correlation heatmap in Python?
The strength and direction of the correlation between two pairs of variables in a dataset are displayed graphically in a correlation heatmap, which depicts the correlation matrix. It is an effective technique for finding patterns and connections in massive datasets.
The Python data visualization toolkit Seaborn offers simple utilities for producing statistical visuals. Users can quickly see the correlation matrix of a dataset thanks to its feature for creating correlation heatmaps.
We must import the dataset, compute the correlation matrix of the variables, and then use the Seaborn heatmap function to produce the heatmap to construct a correlation heatmap. The heatmap displays a matrix with colours that indicate the degree of correlation between the variables. Also, the user can show the correlation coefficients on the heatmap.
Seaborn correlation heatmaps are an effective visualization technique for examining patterns and relationships in datasets and can be used to pinpoint key variables for additional investigation.
Using Heatmap() Function
The heatmap function generates a colour-coded matrix that illustrates how strongly two pairs of variables in a dataset correlate with one another. The heatmap function requires that we feed it the correlation matrix of the variables, which can be calculated using the corr method of the Pandas data frame. The heatmap function offers a wide range of optional options to enable the user to alter the heatmap's visual look, including the colour scheme, annotations, plot size, and location.
Syntax
import seaborn as sns
sns.heatmap(data, cmap=None, annot=None)
The parameter data in the above function is a correlation matrix representing the input dataset. The colormap to be used to colour the heatmap is called cmap.
Example 1
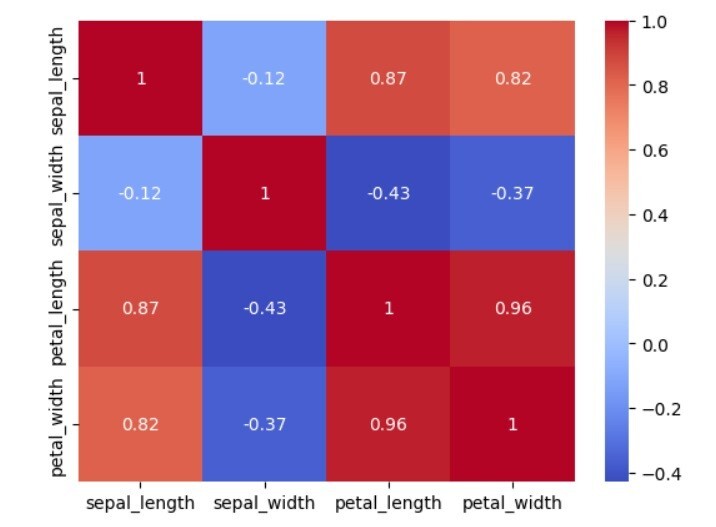
In this example, we create a seaborn correlation heatmap in Python. Firstly, we import the seaborn and matplotlib libraries and use Seaborn's load dataset function to load the iris dataset. The dataset comprises the SepalLength, SepalWidth, PetalLength, and PetalWidth variables. The iris dataset includes measurements of the sepal length, sepal breadth, petal length, and petal width of iris flowers. This is an example of the information ?
| Serial no | sepal_length | sepal_width | petal_length | petal_width | species |
|---|---|---|---|---|---|
| 0 | 5.1 | 3.5 | 1.4 | 0.2 | setosa |
| 1 | 4.9 | 3.0 | 1.4 | 0.2 | Setosa |
| 2 | 4.7 | 3.2 | 1.3 | 0.2 | Setosa |
| 3 | 4.6 | 3.1 | 1.5 | 0.2 | Setosa |
| 4 | 5.0 | 3.6 | 1.4 | 0.2 | setosa |
Users may use Seaborn's load dataset method to load the iris dataset into a Pandas DataFrame. The correlation matrix of the variables is then calculated using the Pandas data frame's corr method and saved in a variable called corr_matrix. We use Seaborn's heatmap method to produce the heatmap. We pass the correlation matrix corr_matrix and set the cmap argument to "coolwarm" to use various colours to denote positive and negative correlations to the function. Lastly, we use the pyplot module from matplotlib's show method to display the heatmap.
# Required libraries
import seaborn as sns
import matplotlib.pyplot as plt

# Load the iris dataset into a Pandas dataframe
iris_data = sns.load_dataset('iris')

# Creating the correlation matrix of the iris dataset
iris_corr_matrix = iris_data.corr()
print(iris_corr_matrix)

# Create the heatmap using the `heatmap` function of Seaborn
sns.heatmap(iris_corr_matrix, cmap='coolwarm', annot=True)

# Display the heatmap using the `show` method of the `pyplot` module from matplotlib.
plt.show()
Output
              sepal_length  sepal_width  petal_length  petal_width
sepal_length      1.000000    -0.117570      0.871754     0.817941
sepal_width      -0.117570     1.000000     -0.428440    -0.366126
petal_length      0.871754    -0.428440      1.000000     0.962865
petal_width       0.817941    -0.366126      0.962865     1.000000
Example 2
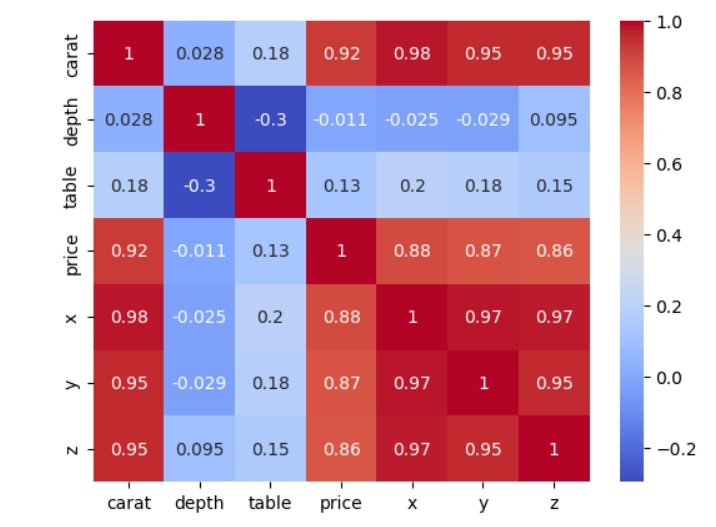
In this example, we again create a seaborn correlation heatmap in Python. Firstly, we import the seaborn and matplotlib libraries and use Seaborn's load dataset function to load the diamonds dataset. The diamonds dataset includes details on the costs and characteristics of diamonds, including their carat weight, cut, colour, and clarity. This is an example of the information ?
| Serial no | carat | cut | color | clarity | depth | table | price | x | y | z |
|---|---|---|---|---|---|---|---|---|---|---|
| 0 | 0.23 | Ideal | E | SI2 | 61.5 | 55.0 | 326 | 3.95 | 3.98 | 2.43 |
| 1 | 0.21 | Premium | E | SI1 | 59.8 | 61.0 | 326 | 3.89 | 3.84 | 2.31 |
| 2 | 0.23 | Good | E | VS1 | 56.9 | 65.0 | 327 | 4.05 | 4.07 | 2.31 |
| 3 | 0.29 | Premium | I | VS2 | 62.4 | 58.0 | 334 | 4.20 | 4.23 | 2.63 |
| 4 | 0.31 | Good | J | SI2 | 63.3 | 58.0 | 335 | 4.34 | 4.35 | 2.75 |
The diamond dataset may be loaded into a Pandas DataFrame using Seaborn's load dataset function. Next, using the Pandas dataframe's corr method, the correlation matrix of the variables is computed and stored in a variable named diamond_corr_matrix. To utilize different colors to signify positive and negative correlations to the function, we pass the correlation matrix corr matrix and set the cmap option to "coolwarm". Lastly, we use the pyplot module from matplotlib's show method to display the heatmap.
# Required libraries
import seaborn as sns
import matplotlib.pyplot as plt

# Load the diamond dataset into a Pandas dataframe
diamonds_data = sns.load_dataset('diamonds')

# Compute the correlation matrix of the variables
diamonds_corr_matrix = diamonds_data.corr()
print(diamonds_corr_matrix)

# Create the heatmap using the `heatmap` function of Seaborn
sns.heatmap(diamonds_corr_matrix, cmap='coolwarm', annot=True)

# Display the heatmap using the `show` method of the `pyplot` module from matplotlib.
plt.show()
Output
          carat     depth     table     price         x         y         z
carat  1.000000  0.028224  0.181618  0.921591  0.975094  0.951722  0.953387
depth  0.028224  1.000000 -0.295779 -0.010647 -0.025289 -0.029341  0.094924
table  0.181618 -0.295779  1.000000  0.127134  0.195344  0.183760  0.150929
price  0.921591 -0.010647  0.127134  1.000000  0.884435  0.865421  0.861249
x      0.975094 -0.025289  0.195344  0.884435  1.000000  0.974701  0.970772
y      0.951722 -0.029341  0.183760  0.865421  0.974701  1.000000  0.952006
z      0.953387  0.094924  0.150929  0.861249  0.970772  0.952006  1.000000

The heatmap is a beneficial graphical representation, and seaborn makes it simple and easy to use.


