- SAP C4C Tutorial
- SAP C4C - Home
- SAP C4C - Introduction
- SAP C4C - Architecture
- SAP C4C - Public vs Private
- SAP C4C - User Interface
- SAP C4C - Work Centers
- Project Implementation & Scoping
- SAP C4C - Fine-Tuning
- Organizational Management
- SAP C4C - Personalization
- SAP C4C - Adaptation
- SAP C4C - Reporting
- SAP C4C - Creating a Custom Report
- SAP C4C - Data Sources
- SAP C4C - Service Level
- SAP C4C - Service Category
- SAP C4C - User Management
- SAP C4C - Business Roles
- SAP C4C - Work Distribution
- SAP C4C - Social
- Data Migration & Workflow
- SAP C4C - Pricing
- SAP C4C - Sales Cycle
- SAP C4C - Retail
- Integration with CRM & ERP
- SAP C4C - Integration with Outlook
- SAP C4C - Mobile
- SAP C4C - Mashups
- SAP C4C Useful Resources
- SAP C4C - Questions and Answers
- SAP C4C - Quick Guide
- SAP C4C - Useful Resources
- SAP C4C - Discussion
SAP C4C - Creating a Custom Report
Many defaults are provided in SAP Cloud for Customer delivered solution. If these reports do not meet the requirement, you can also create custom reports by adding data fields from different sources.
Create a Custom Report
Follow the steps given below to create a Custom Report.
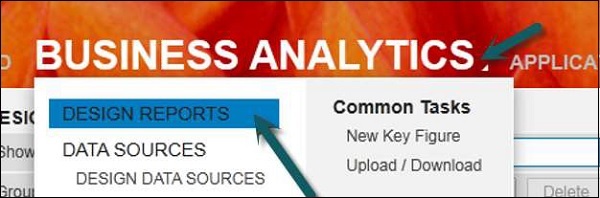
Step 1
Go to Business Analytics Work Center → Design Reports.
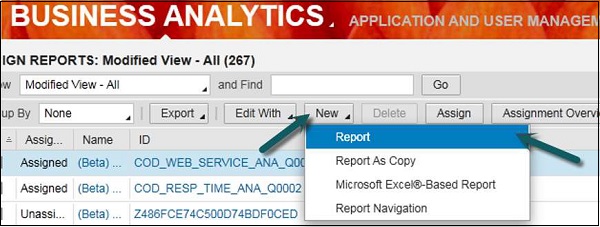
Step 2
To create a new Report, Click New and select Report. There are other options like − Report As Copy which can be used to copy or modify an existing report.
It will open Report creation wizard. To create a report there are certain steps that has to be completed −
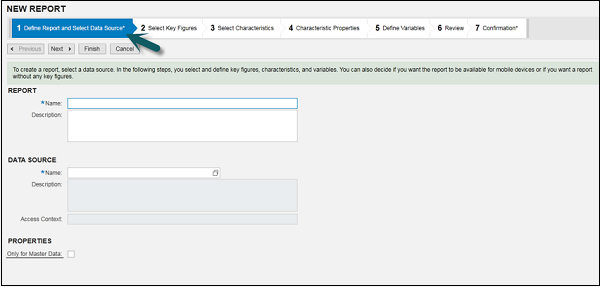
Step 3
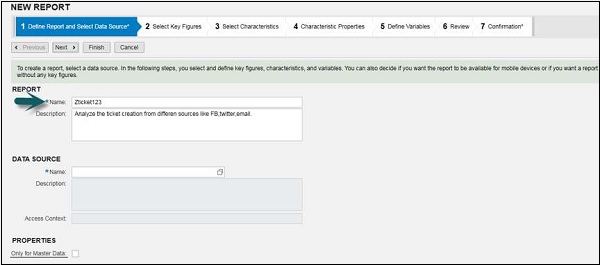
You have to enter the name and description of the new report.
Example − Let us say you want to create a report to analyze the service ticket created from different sources like Facebook, Twitter or via mail. Let us say name it as- ZTicket123.
Enter the description- Analyze the ticket creation from different sources like FB, twitter, email.
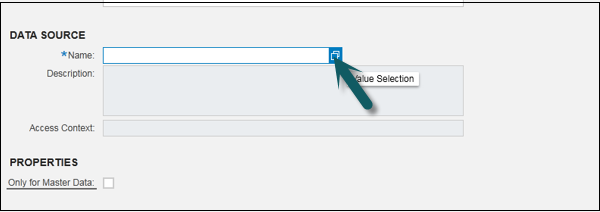
Step 4
Select Data Source. You have to select the data source as per the requirement. Data source contains the fields that are required in report. To add data sources, you should have the knowledge of the data source you are using.
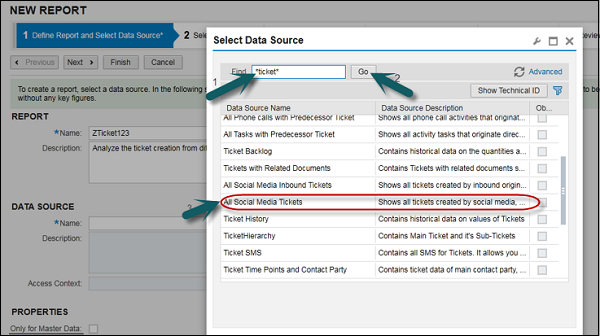
In this scenario, I have selected data source- All Social Media Tickets as it contains the fields that require in the report.
Step 5
To select the data source, type ‘ticket’ and click Go → All Social Media Tickets. Click Next at the top.
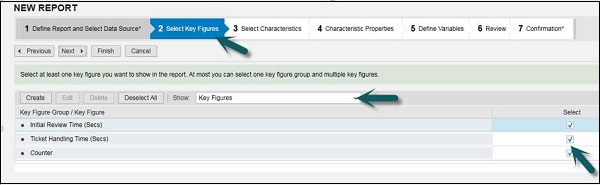
Step 6
Click Select key figures. You can use the check boxes to select the key figures as per requirement. Once you select the key figures, click Next.
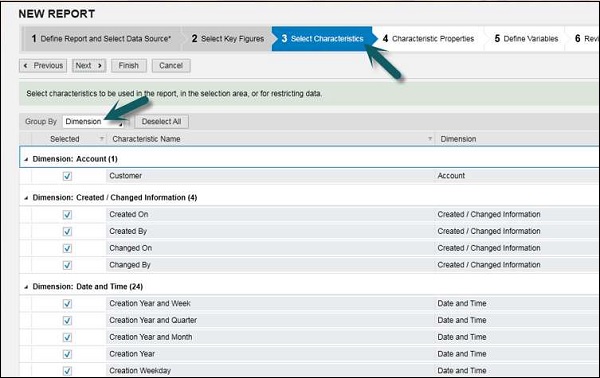
Step 7
Select Characteristics can help you in selecting the characteristics as per the needs. These fields will be available in the report. You can select all or deselect all. Click Next.
Step 8
The next step is to maintain the Characteristic Properties. Click Characteristic Properties. Characteristic Properties includes properties that you want to display in your report.
You can see four tabs for each property- General, Display, Value Selection and Hierarchy.
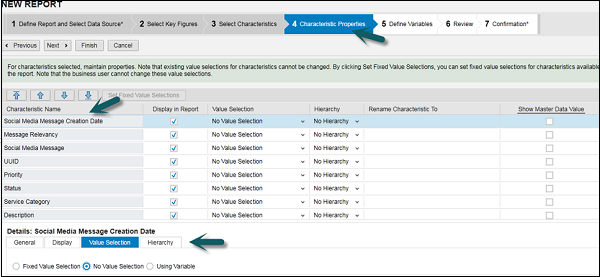
Once you select the property, click Next.
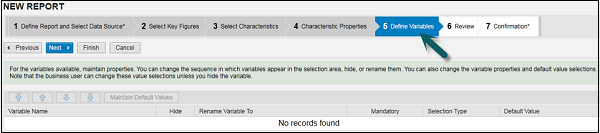
Step 9
Click Define Variables. Enter the variable values. If you select variable value selection for any of the property, you need to define variable in this step. Click Next.
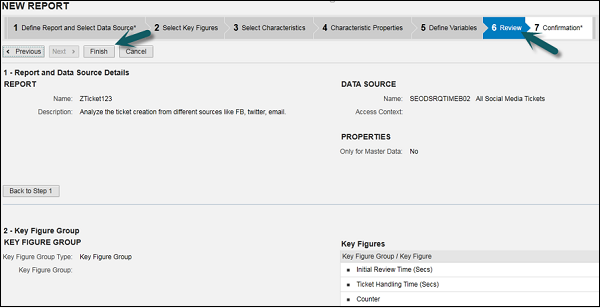
Step 10
Under Review tab, you can review all the fields that are defined for report creation. You can see a summary of key figures, characteristics and properties and any variable values that have been selected in previous steps.
You can also view Data source details- like data source name and description.
Select Key Figures group. Once you review all the fields, click Finish.
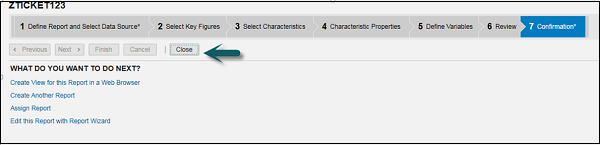
Step 11
Under the Confirmation tab, you will get the confirmation that the report is created. Click Close. You also get different options to create a new report, assign view to this report, etc.
View Created Report
To search for a report, follow the steps given below.
Step 1
Go to Business Analytics → Enter the Report Name → Go.
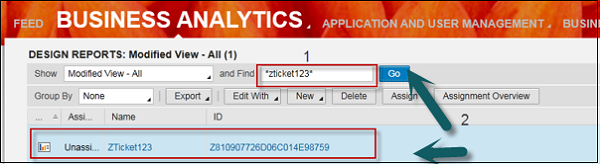
Step 2
Select the report that you have created. On the left side, you can see the following fields −
Columns − It shows the Key figures that you have selected.
Rows − It shows the fields that we have required.
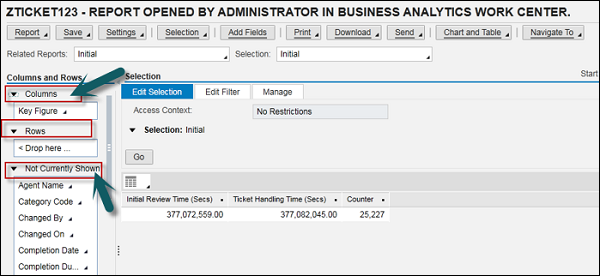
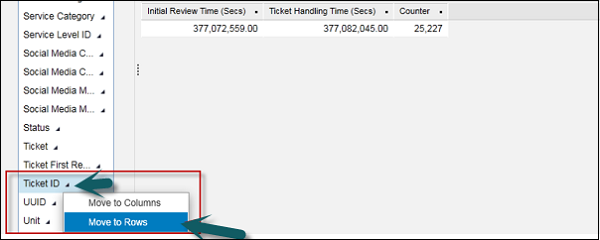
Step 3
Select Not Currently Shown. It shows all the fields that you have selected under characteristics at the time of report creation and you can select fields, which you require in the report. Drag those fields to the rows. To move any field you can drag or click the arrow at the corner of each field and select Move to Rows.
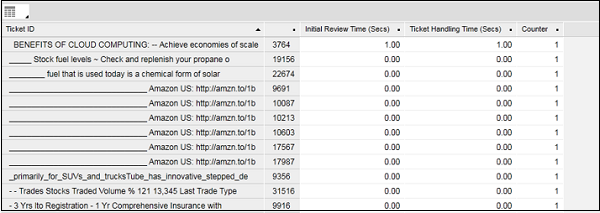
Step 4
Once you add all the characteristics under rows, you can view the report.
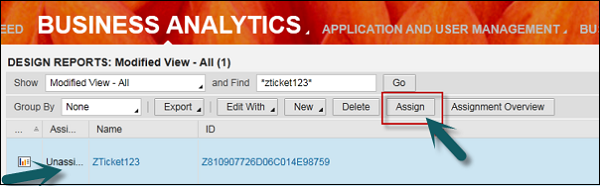
Step 5
To assign a report to the work center, select the report and click Assign.