- QTP Tutorial
- QTP - Home
- QTP - Introduction
- QTP - Test Automation
- QTP - Environment Setup
- QTP - Record and Play Back
- QTP - Object Repository
- QTP - Actions
- QTP - DataTables
- QTP - Checkpoints
- QTP - Synchronization
- QTP - Smart Identification
- QTP - Debugging
- QTP - Error Handling
- QTP - Recovery Scenarios
- QTP - Environment Variables
- QTP - Library Files
- QTP - Test Results
- QTP - GUI Objects
- QTP - Virtual Objects
- QTP - Accessing Databases
- QTP - Working with XML
- QTP - Descriptive Programming
- QTP - Automation Object Model
- QTP - Frameworks
- QTP - Designing a Framework
- QTP Useful Resources
- QTP - Questions and Answers
- QTP - Quick Guide
- QTP - Useful Resources
- QTP - Discussion
QTP - Debugging
Debugging, in automation testing context, is a systematic process of spotting and fixing the coding issues in the automation script so that the script will be more robust and can spot the defects in the application.
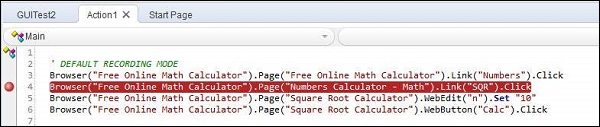
There are various ways to perform debugging using break points in QTP. Break points can be inserted just by pressing "F9" or by using the Menu option "Run" → "Inserting/Removing Break Point".
After Inserting the Break point, the "Red Colored" Dot and the line will be highlighted in RED as shown below −
| Method | ShortCut | Description |
|---|---|---|
| Step Into | F11 | Used to execute each and every Step. Steps into the Function/Action and executes line by line. It pauses on each line after execution. |
| Step Over | F10 | Used to Step over the Function. Step Over runs only the current step in the active document. |
| Step Out | Shift+F11 | After Step Into the function, you can use the Step Out command. Step Out continues the run to the end of the function and then pauses the run session at the next line. |
Options in Break Point
Various Options in Break Point can be accessed by Navigating through the 'Run' Menu.
| Sr.No. | ShortCut & Description |
|---|---|
| 1 | F9 Insert/Remove BreakPoint |
| 2 | Ctrl+F9 Enable/Disable BreakPoint |
| 3 | Ctrl+Shift+F9 Clear All BreakPoint |
| 4 | Use Only Menu Enable/Disable All BreakPoints |
Debugging Pane
The following are the panes in the debugging window −
Output − This Tab displays all the Output of the Print Statements.
Watch − This Tab displays the Boolean output of the Given Expression.
LocalVariables − This Tab displays the Output of the Local Variables.
Example
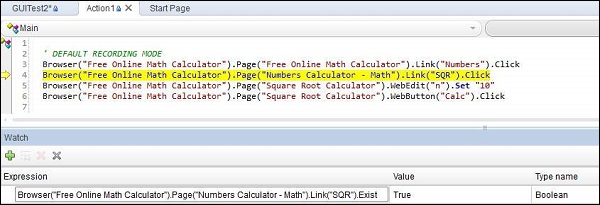
The Watch Pane shows the output expression as shown below −
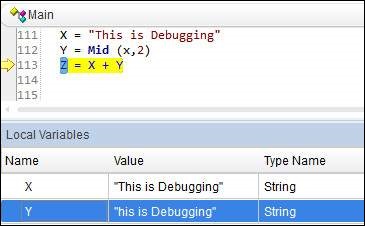
The Local Variables Pane shows the values held by the local variables as shown below −