- OBIEE Tutorial
- OBIEE - Home
- OBIEE - Data Warehouse
- OBIEE - Dimensional Modeling
- OBIEE - Schema
- OBIEE - Basics
- OBIEE - Components
- OBIEE - Architecture
- OBIEE - Repositories
- OBIEE - Business Layer
- OBIEE - Presentation Layer
- OBIEE - Testing Repository
- OBIEE - Multiple Logical Table
- OBIEE - Calculation Measures
- OBIEE - Dimension Hierarchies
- OBIEE - Level-Based Measures
- OBIEE - Aggregates
- OBIEE - Variables
- OBIEE - Dashboards
- OBIEE - Filters
- OBIEE - Views
- OBIEE - Prompts
- OBIEE - Security
- OBIEE - Administration
- OBIEE Useful Resources
- OBIEE - Questions Answers
- OBIEE - Quick Guide
- OBIEE - Useful Resources
- OBIEE - Discussion
OBIEE – Prompts
A Prompt is a special type of filter that is used to filter analyses embedded in a dashboard. The main reason to use a dashboard prompt is that it allows the user to customize analysis output and also allows flexibility to change parameters of a report. There are three types of prompts that can be used −
Named Prompts
The prompt created at the dashboard level is called a Named prompt. This Prompt is created outside of a specific dashboard and stored in the catalog as a prompt. You can apply a named prompt to any dashboard or dashboard page that contains the columns, mentioned in the prompt. It can filter one or any number of analyses embedded on the same dashboard page. You can create and save these named prompts to a private folder or a shared folder.
A named prompt always appears on the dashboard page and the user can prompt for different values without having to rerun the dashboard. A named prompt can also interact with selection steps. You can specify a dashboard prompt to override a specific selection step.
The step will be processed against the dashboard column with the user-specified data values collected by the dashboard column prompt, whereas all other steps will be processed as originally specified.
Inline Prompts
Inline prompts are embedded in an analysis and are not stored in the catalog for reuse. Inline prompt provides general filtering of a column within the analysis, depending on how it is configured.
Inline prompt works independently from a dashboard filter, which determines values for all matching columns on the dashboard. An inline prompt is an initial prompt. When the user selects the prompt value, the prompt field disappears from the analysis.
To select different prompt values, you need to rerun the analysis. Your input determines the content of the analyses embedded in the dashboard.
Named Prompt can be applied to any dashboard or dashboard page which contains the column specified in the Prompt.
Column Prompts
A column prompt is the most common and flexible prompt type. A column prompt enables you to build very specific value prompts to either stand alone on the dashboard or analysis or to expand or refine existing dashboard and analysis filters. Column prompts can be created for hierarchical, measure, or attribute columns at the analysis or dashboard level.
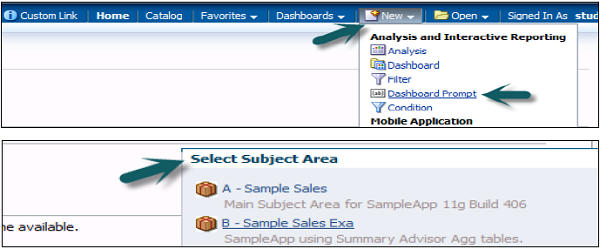
Go to New → Dashboard Prompt → Select subject area.
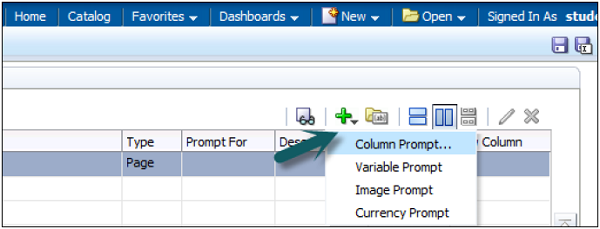
Dashboard prompt dialog box appears. Go to ‘+’ sign, select the prompt type. Click on the column prompt → Select column → Click OK.
New Prompt dialog box appears (this appears only for column prompts). Enter the label name that will appear on dashboard next to Prompt → Select the Operator → User Input.
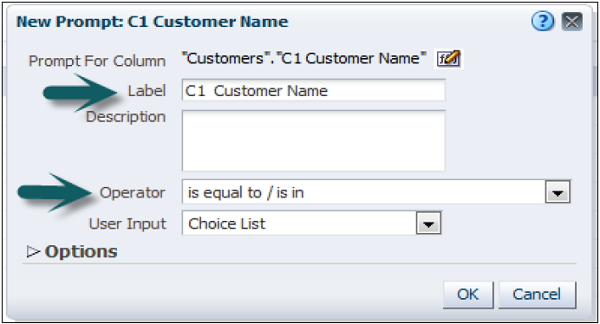
The User Input field's drop-down list appears for column and variable prompts, and provides you with the option to determine the User Input method for the user interface. You can select any of the following − checkboxes, radio buttons, a choice list, or a list box.
Example − If you select the User Input method of Choice List and Choice List Values item of all Column Values, the user will select the prompt's data value from a list that contains all of the data values contained in the data source.
You can also further make a selection by expanding the Options tab.
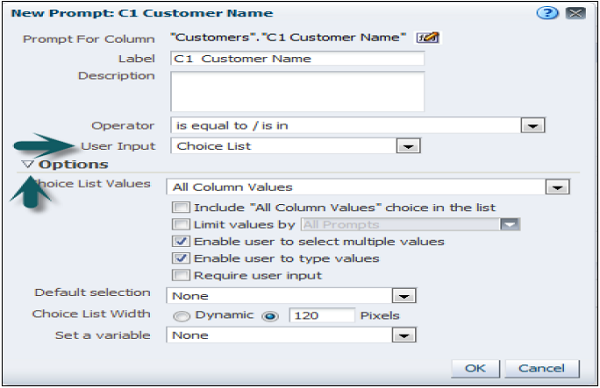
These series of checkboxes allow you to restrict the amount of data returned in output. Once selection is made, click OK.
The Prompt is added to Definition → Save the prompt using the save option at the top right corner → Enter the name → Click OK.
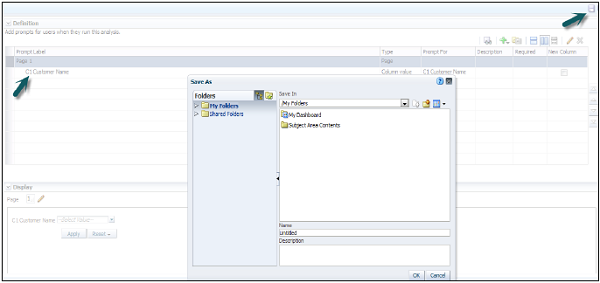
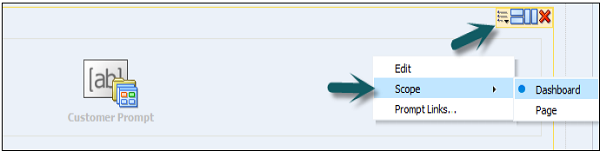
To test the Prompt, go to My Dashboard → Catalog and drag the prompt to column 1. This prompt can be applied to full dashboard or on a single page by clicking on Properties → Scope.
Save and run the Dashboard, select the value for a Prompt. Apply and Output value will change as per prompt value.
Other Prompts
Currency Prompt
A currency prompt enables the user to change the currency type that is displayed in the currency columns on an analysis or dashboard.
Example − Suppose that an analysis contains the sales totals for a certain region of US in US dollars. However, because the users viewing the analysis reside in Canada, they can use the currency prompt to change the sales totals from USD to Canada dollars.
The prompt's currency selection list is populated with the currency preferences from the user’s → My Account dialog → Preferences tab. Currency prompt option is available only if the administrator has configured the userpref_currencies.xml file.
Image Prompt
An image prompt provides an image that users click to select values for an analysis or dashboard.
Example − In a sales organization, users can click their territories from an image of a map to see sales information, or click a product image to see sales information about that product. If you know how to use the HTML <map> tag, then you can create an image map definition.
Variable Prompt
A variable prompt enables the user to select a value that is specified in the variable prompt to display on dashboard. A variable prompt is not dependent upon a column, but can still use a column.
Add Reports to BI Dashboard Pages
You can add one or more existing reports to a dashboard page. The advantage is that you can share reports with other users and schedule the dashboard pages using agents. An agent sends the entire dashboard to the user, including all data pages that the report references.
When configuring an agent for a dashboard page that contains a BI Publisher report, ensure that the following criteria are met −
- The output format of the BI Publisher report must be PDF.
- The agent must be set to deliver PDF.
You can add reports to a dashboard page as embedded content and as a link. Embedded means that the report is displayed directly on the dashboard page. The link opens the report in BI Publisher within Oracle BIEE.
If you modify the report in BI Publisher and save your changes, then refresh the dashboard page to see the modifications. Navigate to the page to which you want to add a report.
Add a BI Report to a Dashboard Page
Select a report in one of the following ways −
Select the report from the Catalog pane and drag and drop it into a section on the dashboard page.
To add a report from a dashboard page, select the report from the folder that contains its dashboard in the Catalog pane.
Set the properties of the object. To do so, hover the mouse pointer over the object in the page layout area to display the object's toolbar, and click the Properties button.
The "BI Publisher Report Properties dialog" is displayed. Complete the fields in the properties dialog as appropriate. Click OK and then click Save.
If required, add a prompt to the dashboard page to filter the results of an embedded parameterized report.