- ASP.NET WP Tutorial
- ASP.NET WP - Home
- ASP.NET WP - Overview
- ASP.NET WP - Environment Setup
- ASP.NET WP - Getting Started
- ASP.NET WP - View Engines
- Project Folder Structure
- ASP.NET WP - Global Pages
- ASP.NET WP - Programming Concepts
- ASP.NET WP - Layouts
- ASP.NET WP - Working with Forms
- ASP.NET WP - Page Object Model
- ASP.NET WP - Database
- ASP.NET WP - Add Data to Database
- ASP.NET WP - Edit Database Data
- ASP.NET WP - Delete Database Data
- ASP.NET WP - WebGrid
- ASP.NET WP - Charts
- ASP.NET WP - Working with Files
- ASP.NET WP - Working with Images
- ASP.NET WP - Working with Videos
- ASP.NET WP - Add Email
- ASP.NET WP - Add Search
- Add Social Networking to the Website
- ASP.NET WP - Caching
- ASP.NET WP - Security
- ASP.NET WP - Publish
- ASP.NET WP Useful Resources
- ASP.NET WP - Quick Guide
- ASP.NET WP - Useful Resources
- ASP.NET WP - Discussion
ASP.NET WP - Charts
In this chapter, we will cover the chart helper and how to display data on charts. In the last chapter, we have displayed data on the WebGrid helper. Chart helper can be used to display data in a graphical format.
The Chart helper can render an image that displays data in a variety of chart types.
It can also support different formatting and labeling options.
It has the ability to render more than 30 types of charts in which you might have seen in Microsoft office, like area chart, bar chart column chart, etc.
Charts show data and additional elements like legends, axes, series, etc.
The data you display in a chart can be from an array, from the results returned from a database, or from the data that's in an XML file.
How to Display Data on Charts?
Let’s have a look into a simple example in which we will display data on the charts. So first we need to create a new CSHTML file.
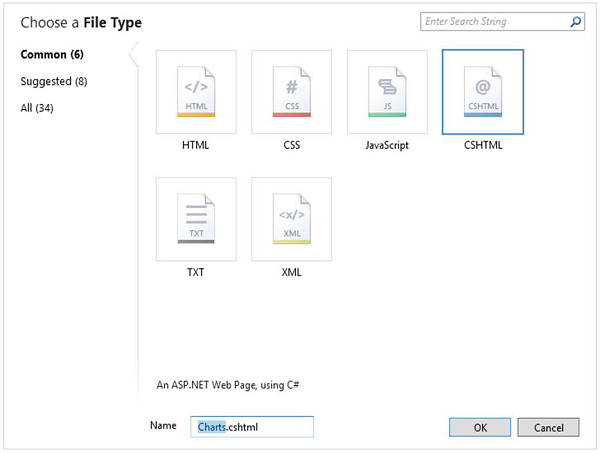
Enter Charts.cshtml in the name field and click OK and then replace the following code in the Charts.cshtml file.
@{
   var myChart = new Chart(width: 600, height: 400)
   .AddTitle("Student Marks (%)")
   .AddSeries(
      name: "Student",
      xValue: new[] { "Allan", "Mark", "Ali", "Kerry", "Steve" },
      yValues: new[] { "79", "53", "73", "81", "43" })
   .Write();
}
As you can see in the above code that first it will create a new chart and the set its width and height.
var myChart = new Chart(width: 600, height: 400)
You can specify the chart title by using the AddTitle method as shown in the following code.
.AddTitle("Student Marks (%)")
The AddSeries method can be used to add data and then assign the values to xValue, and yValues parameters of the AddSeries method. The name parameter is displayed in the chart legend.
.AddSeries(
   name: "Student",
   xValue: new[] { "Allan", "Mark", "Ali", "Kerry", "Steve" },
   yValues: new[] { "79", "53", "73", "81", "43" })
The xValue parameter contains an array of data that will be displayed along the horizontal axis of the chart, while the yValues parameter contains an array of data that will be used to plot the vertical points of the chart.
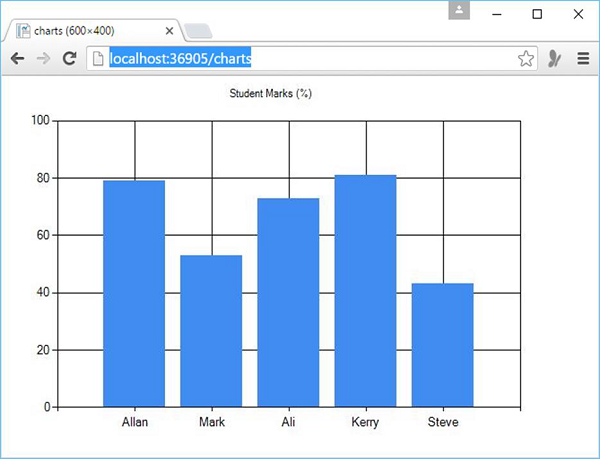
The Write method actually renders the chart. In this case, because you didn't specify a chart type, the Chart helper renders its default chart, which is a column chart.
Now let’s run your application and specify the following url − http://localhost:36905/charts and you will see the following web page.
Now let’s have look into another example in which we will use the database query to retrieve the data and then that data will be displayed on the chart. So, first we need to add another Student table to our database as shown in the following screenshot.
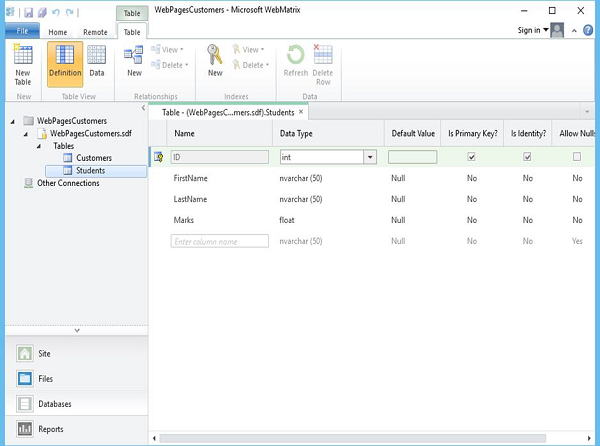
Now let’s add some data to the Students table as shown in the following screenshot.
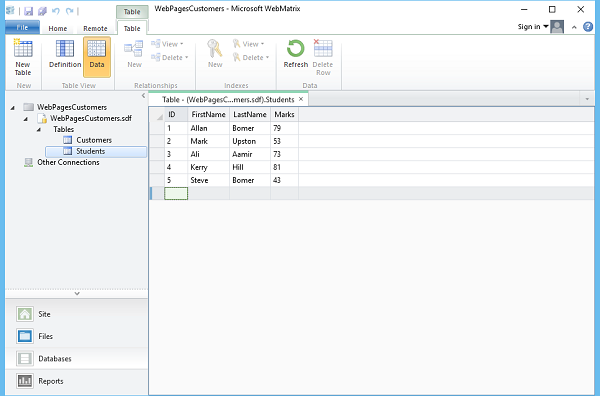
As you can see, now we have Students data.
Now to display this data on the chart, let’s create a new CSHTML file.
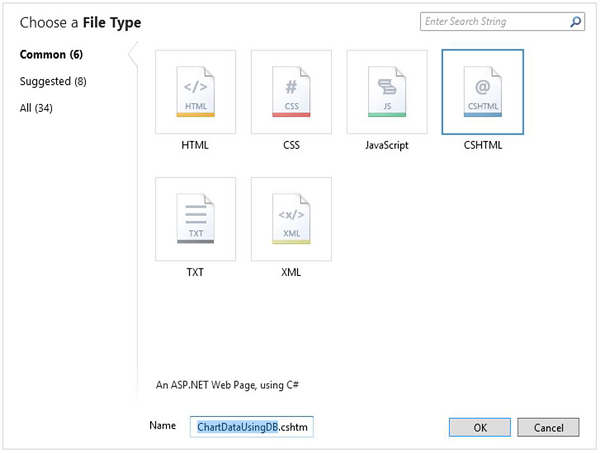
Enter ChartDataUsingDB.cshtml in the Name field and click OK and then replace all the code in ChartDataUsingDB.cshtml file.
@{
   var db = Database.Open("WebPagesCustomers");
   var data = db.Query("SELECT FirstName, Marks FROM Students");
   var myChart = new Chart(width: 600, height: 400)
   .AddTitle("Student Marks")
   .DataBindTable(dataSource: data, xField: "FirstName")
   .Write();
}
As you can see in the above code that first it will open WebPagesCustomers database and then assigns it to a variable named db.
var db = Database.Open("WebPagesCustomers");
Next a simple SQL query is created which will retrieve the FirstName and Marks from the Students table.
var data = db.Query("SELECT FirstName, Marks FROM Students");
Then a new chart is created and passes the database query to it by calling the chart's DataBindTable method.
var myChart = new Chart(width: 600, height: 400)
   .AddTitle("Student Marks")
   .DataBindTable(dataSource: data, xField: "FirstName")
   .Write();
This method takes two parameters
The dataSource parameter is for the data from the query.
The xField parameter lets you set which data column is used for the chart's x-axis.
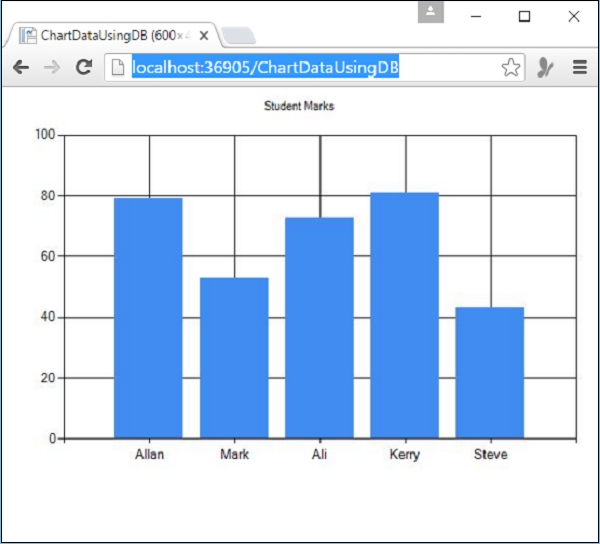
Now let’s run this application and specify the following url − http://localhost:36905/ChartDataUsingDB and you will see the following web page.
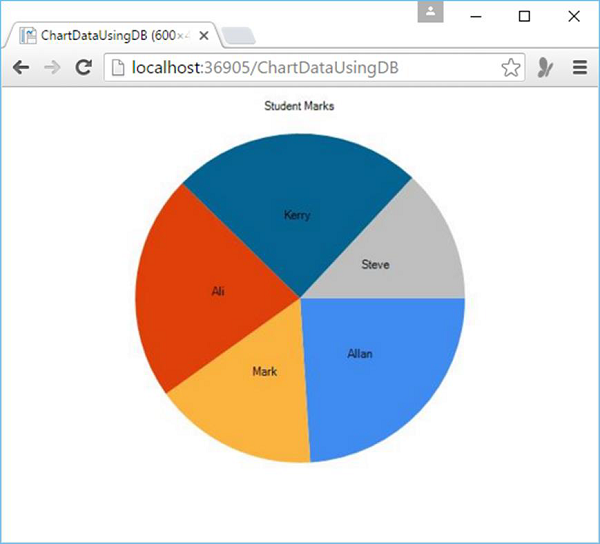
You can use the AddSeries method instead of DataBindTable and you can also specify the chart type parameter in the AddSeries method as shown in the following code.
@{
   var db = Database.Open("WebPagesCustomers");
   var data = db.Query("SELECT FirstName, Marks FROM Students");
   var myChart = new Chart(width: 600, height: 400)
      .AddTitle("Student Marks")
      .AddSeries("Default", chartType: "Pie",
      xValue: data, xField: "FirstName",
      yValues: data, yFields: "Marks")
      .Write();
}
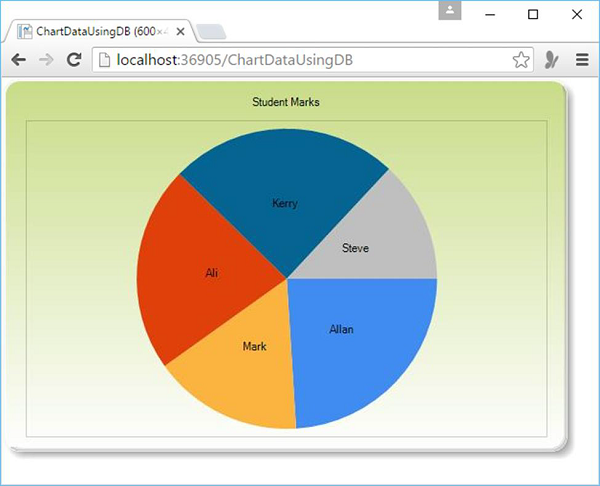
Now let’s run the application again and specify the following url − http://localhost:36905/ChartDataUsingDB and you will see the following web page.
You can also change the theme of the chart by simply specifying the theme parameter while creating a chart as explained in the following code.
var myChart = new Chart(width: 600, height: 400, theme: ChartTheme.Green)
Now let’s run this application again and specify the following url − http://localhost:36905/ChartDataUsingDB and you will see the following web page.