 Data Structure
 Networking
 RDBMS
RDBMS Operating System
 Java
Java MS Excel
 iOS
iOS HTML
HTML CSS
CSS Android
 Python
 C Programming
 C++
C++ C#
C# MongoDB
 MySQL
MySQL Javascript
 PHP
PHP
- Selected Reading
- UPSC IAS Exams Notes
- Developer's Best Practices
- Questions and Answers
- Effective Resume Writing
- HR Interview Questions
- Computer Glossary
- Who is Who
Plotting the Growth Curve of Coronavirus in various Countries using Python
"Explore the dynamic world of COVID-19 through Python as we analyze, visualize, and predict the growth curve of the virus in different countries. In this article, by utilizing data preprocessing, cleaning, and powerful libraries like pandas and matplotlib, we dive into the interactive realm of plotting and predicting the pandemic's impact, offering insights into its trajectory and global reach."
Plotting the Growth Curve of coronavirus in various Countries using Python
We will be a graph visualize the growth of the total number of cases and the total deaths for a given country which will be provided by the user and also print the list of countries that are available. The dataset used in this article can be downloaded from here ? https://ourworldindata.org/.
Below are the steps that we will follow to plot the Growth Curve of Coronavirus in various Countries using Python ?
Importing Required Libraries ?
We begin by importing the necessary libraries: pandas and plotly.express.
pandas is used for data manipulation and preprocessing.
plotly.express is used for creating interactive visualizations.
Loading the Data ?
The program loads the COVID-19 data from the 'owid-covid-data.csv' file using the pd.read_csv() function from the pandas library.
The data contains information about the date, location, and total cases.
Data Preprocessing and Cleaning ?
We perform data preprocessing and cleaning to prepare the data for analysis.
We select the relevant columns for analysis, which include 'date', 'location', and 'total_cases'.
Any rows with missing values are dropped using the dropna() function.
Getting the List of Available Countries ?
We extract the unique country names from the 'location' column of the data using the unique() function.
This creates a list of available countries for later use.
Analyzing the Data ?
We group the data by location using the groupby() function and calculate the maximum total cases for each location using the max() function.
The resulting grouped data is sorted in descending order based on the total cases.
Plotting the Growth Curve ?
We prompt the user to enter a country name using the input() function.
If the entered country name is valid (i.e., it exists in the available countries list), we proceed with plotting the growth curve for that country.
We filter the data to extract the rows corresponding to the specified country using boolean indexing (data['location'] == country_name).
The filtered data is passed to the px.line() function from plotly.express to create the line plot.
The x parameter is set to 'date' and the y parameter is set to 'total_cases'.
Displaying and Saving the Graph ?
We display the interactive growth curve plot using the fig.show() function.
To save the graph as an HTML file, we use the fig.write_html() function and provide the desired file name ('growth_curve.html').
A confirmation message is printed, indicating that the graph has been saved successfully.
Displaying the List of Available Countries ?
Finally, we display the list of available countries for the user to reference.
Each country name is printed using a loop that iterates over the 'countries' list.
The title of the plot is set to include the selected country name.
Example
Below is the program example using the above steps ?
import pandas as pd
import plotly.express as px

# Step 1: Load the data
data = pd.read_csv('owid-covid-data.csv')

# Step 2: Data preprocessing and cleaning
# Select the relevant columns for analysis
data = data[['date', 'location', 'total_cases']]

# Remove rows with missing values
data = data.dropna()

# Get the list of available countries
countries = data['location'].unique()

# Step 3: Analyzing the data
# Group the data by location and calculate the total cases for each location
grouped_data = data.groupby('location')['total_cases'].max()

# Sort the data in descending order
sorted_data = grouped_data.sort_values(ascending=False)

# Step 4: Data prediction
# Fit a curve to the data using polynomial regression or any other suitable method

# Step 5: Plotting the growth curve
# Prompt the user to enter a country name
country_name = input("Enter a country name: ")

if country_name in countries:
   # Plot the growth curve for the specified country
   country_data = data[data['location'] == country_name]

   # Create the plot using Plotly
   fig = px.line(country_data, x='date', y='total_cases', title=f'COVID-19 Growth Curve in {country_name}')
   fig.show()

   # Save the plot as an HTML file
   fig.write_html('growth_curve.html')

   print(f"Graph saved as 'growth_curve.html'")
else:
   print("Invalid country name. Please try again.")

# Display the list of available countries
print("Available countries:")
for country in countries:
   print(country)
Output
When we run the above code it will ask us to enter a country name ?

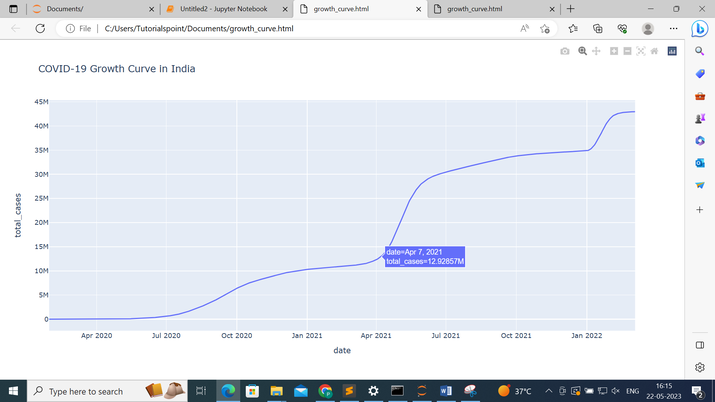
Suppose we provide the country name as India and after that, we will press the enter button it will give us the following output ?

It will show us the graph and the list of available countries from which we can choose any country and the graph is saved as ?growth_curve.html'.
Below is the ?growth_curve.html' which has the growth curve of India ?

Conclusion
In conclusion, Python, along with libraries like pandas and matplotlib, provides a versatile platform for analyzing and visualizing the growth curve of COVID-19 in different countries. By leveraging data preprocessing, cleaning, and visualization techniques, we gain valuable insights into the global impact of the pandemic, empowering us to make informed decisions and take necessary actions.

