 Data Structure
 Networking
 RDBMS
RDBMS Operating System
 Java
Java MS Excel
 iOS
iOS HTML
HTML CSS
CSS Android
 Python
 C Programming
 C++
C++ C#
C# MongoDB
 MySQL
MySQL Javascript
 PHP
PHP
- Selected Reading
- UPSC IAS Exams Notes
- Developer's Best Practices
- Questions and Answers
- Effective Resume Writing
- HR Interview Questions
- Computer Glossary
- Who is Who
Plotting random points under sine curve in Python Matplotlib
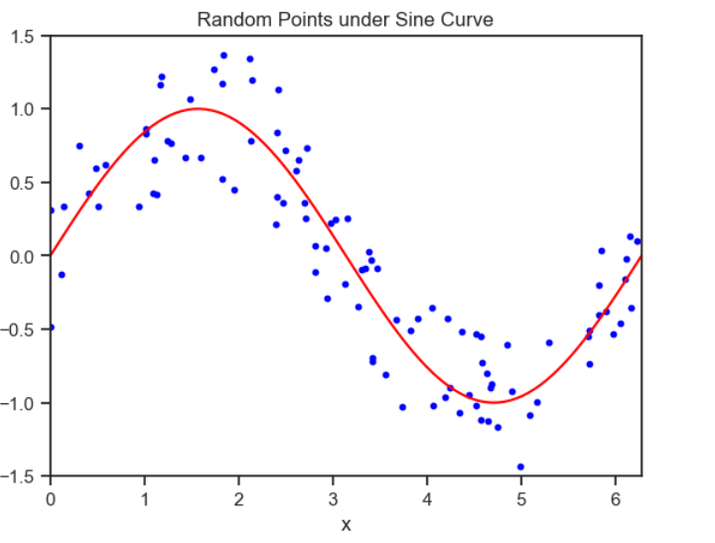
Plotting random points under a sine curve is a fascinating visual exercise that demonstrates the versatility of Matplotlib in Python. By generating random points and offsetting them along the y-axis, we can create a scatter plot that appears to follow the shape of a sine wave.
This article delves into the process of generating these random points, calculating their corresponding y-coordinates using the sine function, and visualizing the results using Matplotlib. We'll gain a deeper understanding of how to leverage Matplotlib's plotting capabilities to create engaging and dynamic visualizations.
How to plot random points under a sine curve in Python Matplotlib?
Below is the complete step-by-step explanation of the program that we will see in the next section ?
Import the necessary libraries ?
numpy is imported to generate random numbers and perform mathematical computations.
matplotlib.pyplot is imported to create plots and visualizations.
Define the number of random points ?
num_points variable is set to the desired number of random points to generate.
Generate random x-coordinates ?
np.random.uniform(0, 2 * np.pi, num_points) generates an array of num_points random values between 0 and 2? (inclusive). These values will serve as the x-coordinates for the points.
Compute y-coordinates using the sine function ?
np.sin(x) computes the sine values of the x-coordinates generated in the previous step. This gives us the y-coordinates for the points lying on the sine curve.
Generate random offsets for the y-coordinates ?
np.random.uniform(-0.5, 0.5, num_points) generates an array of random values between -0.5 and 0.5. These values will be used to offset the y-coordinates, scattering the points around the sine curve.
Add offsets to the y-coordinates ?
y += offsets adds the random offsets to the y-coordinates generated in step 4, creating a scattered distribution of points around the sine curve.
Plot the points ?
plt.scatter(x, y, color='blue', s=10) creates a scatter plot of the random points. The x-coordinates are given by the array x, the y-coordinates are given by the array y, the color of the points is set to blue, and the size of the points is set to 10.
Plot the sine curve ?
x_vals = np.linspace(0, 2 * np.pi, 100) generates 100 evenly spaced values between 0 and 2?. These values will be used as x-coordinates for plotting the sine curve.
y_vals = np.sin(x_vals) computes the sine values of the x-coordinates generated above, giving us the y-coordinates for the sine curve.
plt.plot(x_vals, y_vals, color='red') plots the sine curve using the x-coordinates x_vals and y-coordinates y_vals. The color of the curve is set to red.
Set the x-axis and y-axis limits ?
plt.xlim(0, 2 * np.pi) sets the limits of the x-axis to span from 0 to 2?.
plt.ylim(-1.5, 1.5) sets the limits of the y-axis to span from -1.5 to 1.5.
Set labels and title ?
plt.xlabel('x') sets the label for the x-axis as 'x'.
plt.ylabel('y') sets the label for the y-axis as 'y'.
plt.title('Random Points under Sine Curve') sets the title of the plot as 'Random Points under Sine Curve'.
Display the plot ?
plt.show() displays the plot with all the specified elements (points, sine curve, labels, and title).
Example
Below is the program example using the above steps.
import numpy as np
import matplotlib.pyplot as plt

# Number of random points to generate
num_points = 100

# Generate random x-coordinates between 0 and 2*pi
x = np.random.uniform(0, 2 * np.pi, num_points)

# Compute corresponding y-coordinates using the sine function
y = np.sin(x)

# Generate random offsets for the y-coordinates
offsets = np.random.uniform(-0.5, 0.5, num_points)

# Add offsets to the y-coordinates
y += offsets

# Plot the points
plt.scatter(x, y, color='blue', s=10)

# Plot the sine curve
x_vals = np.linspace(0, 2 * np.pi, 100)
y_vals = np.sin(x_vals)
plt.plot(x_vals, y_vals, color='red')

# Set the x-axis and y-axis limits
plt.xlim(0, 2 * np.pi)
plt.ylim(-1.5, 1.5)

# Set labels and title
plt.xlabel('x')
plt.ylabel('y')
plt.title('Random Points under Sine Curve')

# Display the plot
plt.show()
Output

Conclusion
By harnessing the power of Python's Matplotlib library, we have successfully demonstrated how to plot random points under a sine curve. This article highlights the versatility and flexibility of Matplotlib in creating captivating visualizations. Through the generation of random points and their strategic placement along the y-axis, we can observe the emergence of a sinusoidal pattern.

