
Article Categories
- All Categories
-
 Data Structure
-
 Networking
-
 RDBMS
RDBMS
-
 Operating System
-
 Java
Java
-
 MS Excel
-
 iOS
iOS
-
 HTML
HTML
-
 CSS
CSS
-
 Android
-
 Python
-
 C Programming
-
 C++
C++
-
 C#
C#
-
 MongoDB
-
 MySQL
MySQL
-
 Javascript
-
 PHP
PHP
Plotting ICMR approved test centers on Google Maps using folium package
In the quest to combat the COVID-19 pandemic, accurate and accessible information about ICMR-approved test centers is crucial which can be done with the help of a python package called folium. This article explores how to leverage the power of Python and the folium package to plot these test centers on Google Maps.
By combining geospatial data with interactive mapping capabilities, we empower individuals to easily locate nearby testing facilities. With a step-by-step guide, we demonstrate how to harness the folium package to create dynamic maps, customize markers, and provide informative pop-ups. By enabling the visualization of ICMR-approved test centers, this approach plays a vital role in promoting awareness, accessibility, and efficient utilization of healthcare resources.
Folium package
The folium package is a Python library that enables the creation of dynamic and personalized maps using the Leaflet.js JavaScript library. It offers a user-friendly interface for generating maps with diverse features like tilesets, markers, polygons, and more. With folium, you can easily plot geographical data, such as points of interest, routes, and regions, using various map styles like Google Maps or OpenStreetMap. Its flexibility allows for customization of map elements and interactive popups, making it widely favored for tasks like data visualization, spatial analysis, and the creation of interactive web maps directly within Python scripts.
How to plot ICMR approved test centers on Google Maps using folium package?
To plot ICMR-approved test centers on Google Maps using the folium package in Python, follow the steps given below ?
Install the folium package by running pip install folium in your command prompt or terminal.
Obtain the dataset containing ICMR-approved test center information. It can be in various formats such as CSV, Excel, or JSON. Ensure the dataset includes the necessary details like latitude, longitude, center name, and address. The dataset that we will be using can be downloaded from here.
Import the required libraries in your Python script: import folium to use the folium package and pandas if you need to read the dataset.
Create a map centered around the desired location. For example, you can set the map's center to India using map_center = [20.5937, 78.9629] and initialize the map with m = folium.Map(location=map_center, zoom_start=5).
Load the ICMR-approved test center data from your dataset into a pandas DataFrame or any suitable data structure.
Iterate over the test center data. Extract the latitude, longitude, center name, and address for each test center.
Create a marker for each test center using folium.Marker and add it to the map using the add_to method. Customize the marker's appearance and popup information as desired.
Save the map as an HTML file using m.save('test_centers_map.html').
Run the script and open the generated HTML file in a web browser to view the plotted ICMR-approved test centers on Google Maps.
Example
Below is the program Plotting ICMR approved test centers on Google Maps using folium package ?
import folium
import pandas as pd

# Read the ICMR-approved test centers data from a CSV file
data = pd.read_csv('ICMRTestingLabsWithCoords.csv')

# Create a map centered on India
map_center = [20.5937, 78.9629]
m = folium.Map(location=map_center, zoom_start=5)

# Iterate over the test center data
for index, row in data.iterrows():
   # Extract the latitude and longitude of each test center
   lat = row['latitude']
   lon = row['longitude']
   name = row['lab']
   address = row['address']

   # Create a marker for the test center and add it to the map
   folium.Marker([lat, lon], popup=f'<strong>{name}</strong><br>{address}').add_to(m)

# Save the map to an HTML file
m.save('test_centers_map.html')
Output
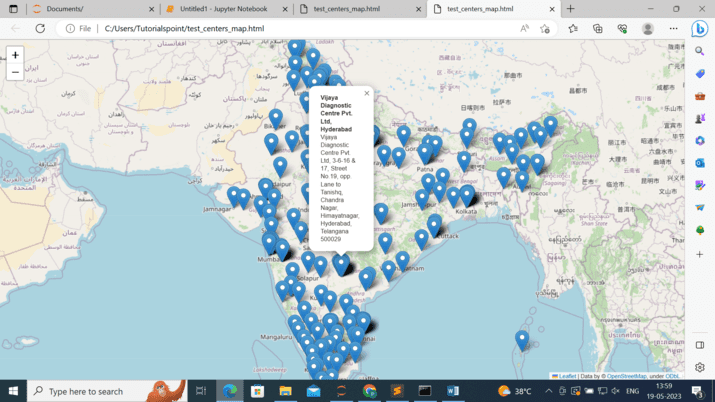
After running the program, it will generate an HTML file named "test_centers_map.html" containing the interactive map with the ICMR-approved test centers plotted as markers. We can open this file in a web browser to view the map.
Conclusion
In conclusion, the utilization of the folium package provides a powerful and intuitive solution for plotting ICMR-approved test centers on Google Maps. By leveraging Python's capabilities, we can seamlessly integrate geographical data, allowing users to locate and access vital testing facilities with ease. The interactive nature of the maps, along with the ability to customize markers and popups, enhances the overall user experience.
The application of folium in visualizing test centers not only aids in efficient planning and navigation but also serves as a valuable resource for individuals seeking COVID-19 testing. Harnessing the potential of folium, we contribute to the accessibility and effectiveness of healthcare services during these challenging times.

220 Views
