 Data Structure
 Networking
 RDBMS
RDBMS Operating System
 Java
Java MS Excel
 iOS
iOS HTML
HTML CSS
CSS Android
 Python
 C Programming
 C++
C++ C#
C# MongoDB
 MySQL
MySQL Javascript
 PHP
PHP
- Selected Reading
- UPSC IAS Exams Notes
- Developer's Best Practices
- Questions and Answers
- Effective Resume Writing
- HR Interview Questions
- Computer Glossary
- Who is Who
Pandas timeseries plot setting X-axis major and minor ticks and labels
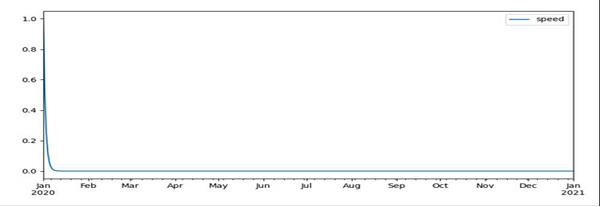
Using Pandas, we can create a dataframe with time and speed, and thereafter, we can use the data frame to get the desired plot.
Steps
Construct a new Generator with the default BitGenerator (PCG64).
Using Pandas, get a fixed frequency DatetimeIndex. From '2020-01-01' to '2021-01-01'.
Draw samples from a log-normal distribution.
Make a data frame with above data.
Using panda dataframe create plot, with figsize = (10, 5).
To show the figure, use the plt.show() method.
Example
import numpy as np
import pandas as pd
from matplotlib import pyplot as plt

rng = np.random.default_rng(seed=1)
date_day = pd.date_range(start='2020-01-01', end='2021-01-01', freq='D')
traffic = rng.lognormal(sigma=2, size=date_day.size)
df_day = pd.DataFrame(dict(speed=[pow(2, -i) for i in range(len(date_day))]),
index=date_day)

df_day.plot(figsize=(10, 5))

plt.show()
Output


Advertisements
