- Jenkins - Home
- Jenkins - Overview
- Jenkins - Installation
- Jenkins - Tomcat Setup
- Jenkins - Git Setup
- Jenkins - Maven Setup
- Jenkins - Configuration
- Jenkins - Management
- Jenkins - Setup Build Jobs
- Jenkins - Unit Testing
- Jenkins - Automated Testing
- Jenkins - Notification
- Jenkins - Reporting
- Jenkins - Code Analysis
- Jenkins - Distributed Builds
- Jenkins - Automated Deployment
- Jenkins - Metrics and Trends
- Jenkins - Server Maintenance
- Jenkins - Continuous Deployment
- Jenkins - Managing Plugins
- Jenkins - Security
- Jenkins - Backup Plugin
- Jenkins - Remote Testing
Jenkins - Metrics & Trends
There are various plugins which are available in Jenkins to showcase metrics for builds which are carried out over a period of time. These metrics are useful to understand your builds and how frequently they fail/pass over time. As an example, lets look at the Build History Metrics plugin.
This plugin calculates the following metrics for all of the builds once installed
- Mean Time To Failure (MTTF)
- Mean Time To Recovery (MTTR)
- Standard Deviation of Build Times
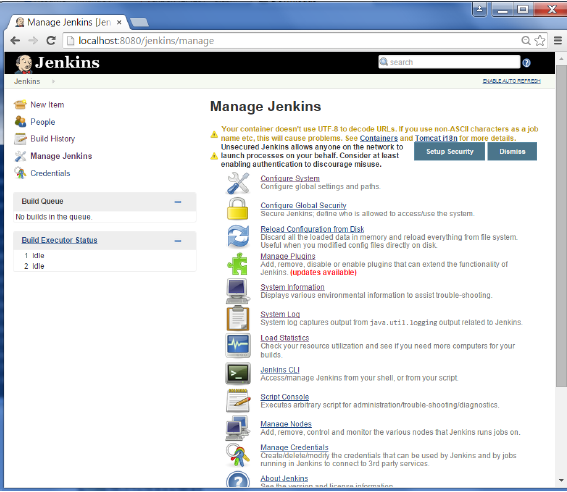
Step 1 − Go to the Jenkins dashboard and click on Manage Jenkins
Step 2 − Go to the Manage Plugins option.
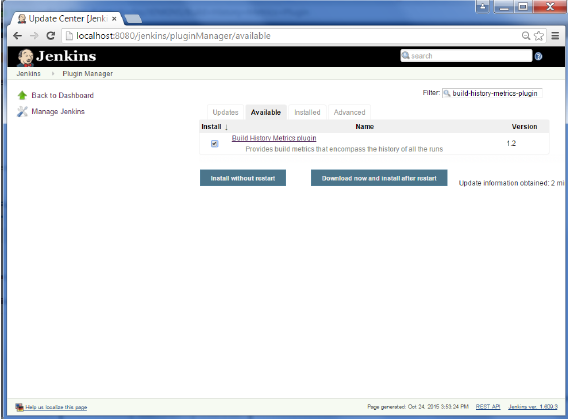
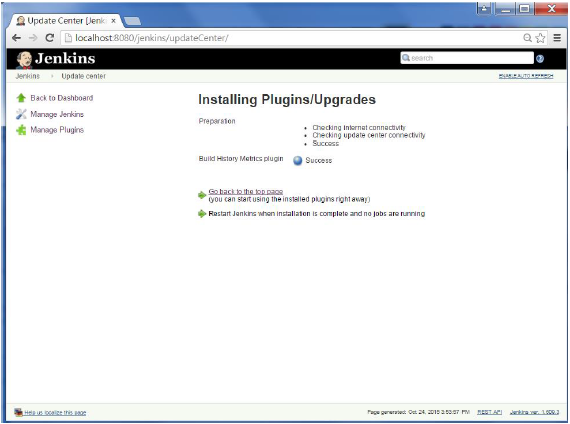
Step 3 − Go to the Available tab and search for the plugin Build History Metrics plugin and choose to install without restart.
Step 4 − The following screen shows up to confirm successful installation of the plugin. Restart the Jenkins instance.
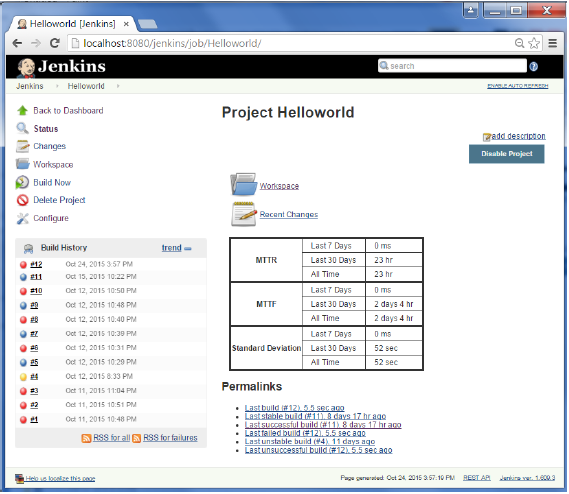
When you go to your Job page, you will see a table with the calculated metrics. Metrics are shown for the last 7 days, last 30 days and all time.
To see overall trends in Jenkins, there are plugins available to gather information from within the builds and Jenkins and display them in a graphical format. One example of such a plugin is the Hudson global-build-stats plugin. So lets go through the steps for this.
Step 1 − Go to the Jenkins dashboard and click on Manage Jenkins
Step 2 − Go to the Manage Plugins option

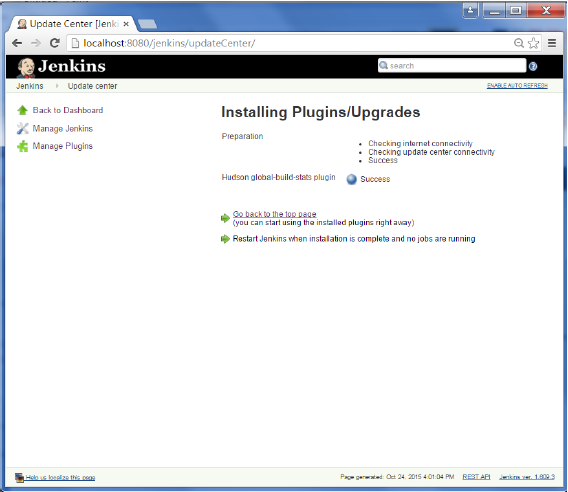
Step 3 − Go to the Available tab and search for the plugin Hudson global-build-stats plugin and choose to install without restart.
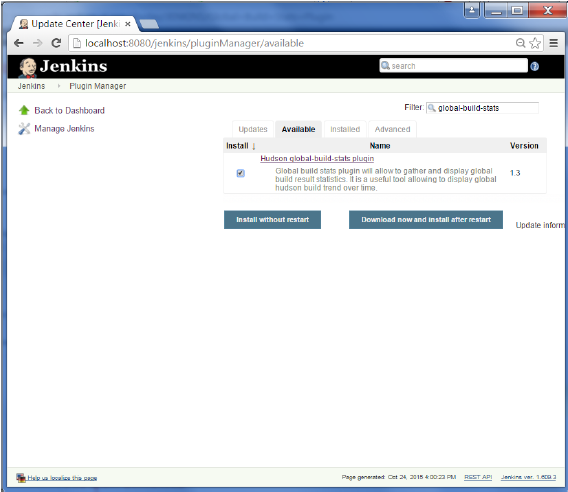
Step 4 − The following screen shows up to confirm successful installation of the plugin. Restart the Jenkins instance.
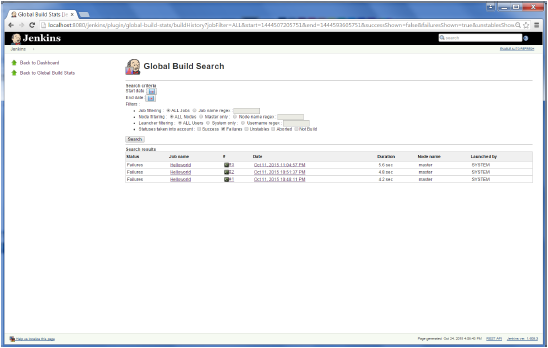
To see the Global statistics, please follow the Step 5 through 8.
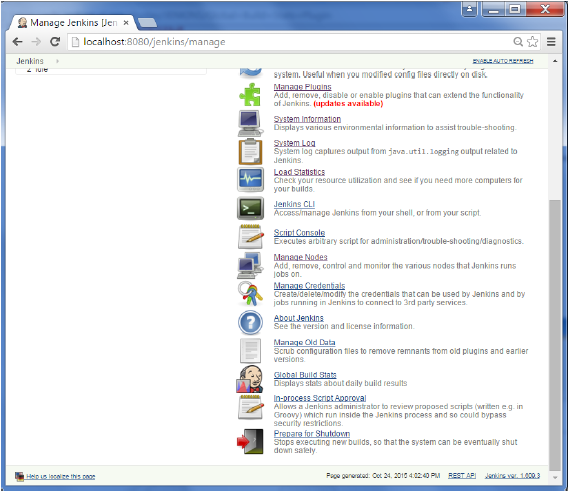
Step 5 − Go to the Jenkins dashboard and click on Manage Jenkins. In the Manage Jenkins screen, scroll down and now you will now see an option called Global Build Stats. Click on this link.
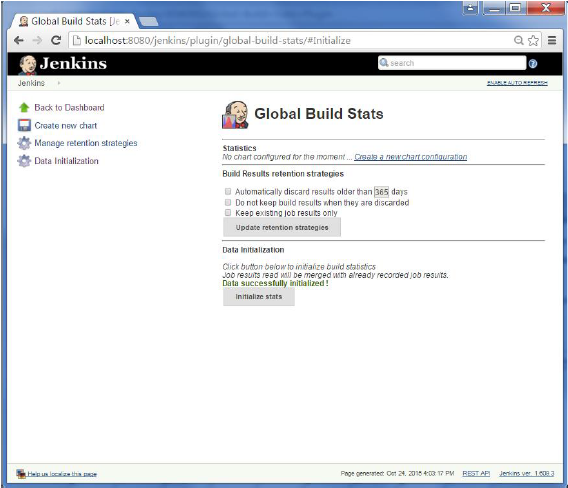
Step 6 − Click on the button Initialize stats. What this does is that it gathers all the existing records for builds which have already been carried out and charts can be created based on these results.
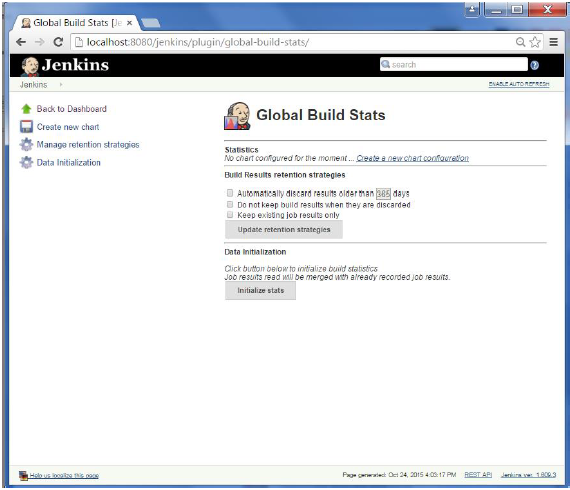
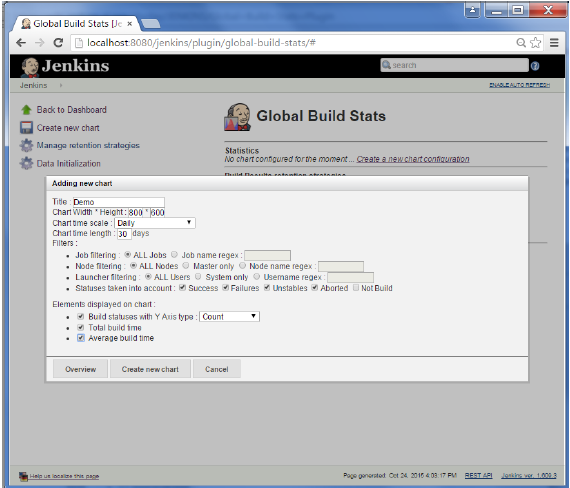
Step 7 − Once the data has been initialized, its time to create a new chart. Click on the Create new chart link.
Step 8 − A pop-up will come to enter relevant information for the new chart details. Enter the following mandatory information
- Title Any title information, for this example is given as Demo
- Chart Width 800
- Chart Height 600
- Chart time scale Daily
- Chart time length 30 days
The rest of the information can remain as it is. Once the information is entered, click on Create New chart.
You will now see the chart which displays the trends of the builds over time.
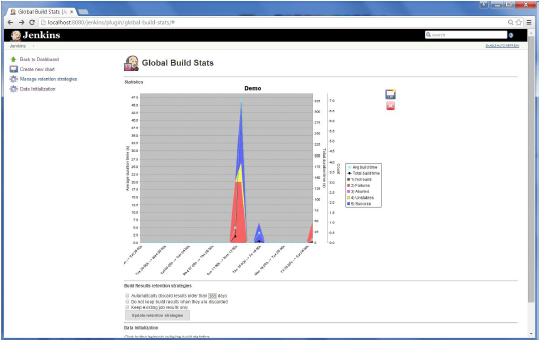
If you click on any section within the chart, it will give you a drill down of the details of the job and their builds.