 Data Structure
 Networking
 RDBMS
RDBMS Operating System
 Java
Java MS Excel
 iOS
iOS HTML
HTML CSS
CSS Android
 Python
 C Programming
 C++
C++ C#
C# MongoDB
 MySQL
MySQL Javascript
 PHP
PHP
- Selected Reading
- UPSC IAS Exams Notes
- Developer's Best Practices
- Questions and Answers
- Effective Resume Writing
- HR Interview Questions
- Computer Glossary
- Who is Who
Plot Multiple Plots in Matplotlib
Python provides a powerful library named Matplotlib that creates visual representations in the form of plots and graphs. One of the many features of this library is the ability to plot multiple plots within a single figure that are useful when comparing different datasets or visualizing relationships between multiple variables. We are going to explore the built-in method named 'subplots()' of Matplotlib that is used to plot multiple plots.
Python program to plot multiple plots in Matplotlib
Before jumping to the program directly let's familiarize ourselves with subplots() method of Matplotlib.
subplots() method
With a single call of 'subplots()' method, we can create one or more than one subplots within a single figure. It provides appropriate control over the plots and also, allows us to customize their layout and appearance.
Syntax
subplots(numOfrows, numOfcols)
Here, 'numOfrows' and 'numOfcols' specify the number of rows and columns respectively of grid.
However, we can also add some more additional attributes as per the need.
Example 1
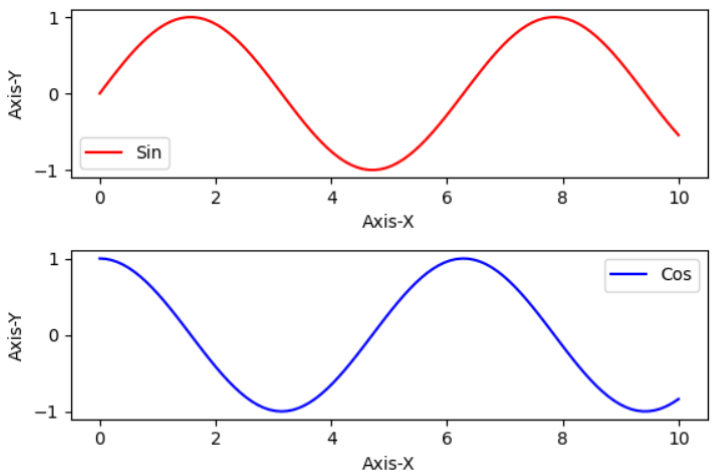
In the following example, we will plot two subplots of sine and cosine functions.
Approach
First, we will import the matplotlib and numpy. The matplotlib will be used for the visual representation of data generated by numpy.
Generate an array of 100 evenly spaced values between 0 and 10 using the in-built method 'linspace()' of NumPy. Then, calculate the sine and cosine values for each element in the x array and stores them in y1 and y2 respectively.
Now, use the 'subplots()' method to create two subplots arranged vertically. This method will return a figure object named 'fig' and a tuple of subplot axes 'ax1' and 'ax2'. Here, 'figsize' sets the size of the figure.
Plot the x values against the y1 values on the first subplot ax1.
Similarly, plot the x values against the y2 values on the second subplot ax2.
Use the 'tight_layout()' method to adjust the spacing between the subplots to prevent overlapping.
In the end, display the plots and exit.
import matplotlib.pyplot as plt
import numpy as np
# generating some random data for plotting
val = np.linspace(0, 10, 100)
pl1 = np.sin(val)
pl2 = np.cos(val)
# Creating subplots
fig, (axs1, axs2) = plt.subplots(2, 1, figsize = (6, 4))
# Plotting of the first subplot
axs1.plot(val, pl1, 'r', label = 'Sin')
axs1.set_xlabel('Axis-X')
axs1.set_ylabel('Axis-Y')
axs1.legend()
# Plotting of the second subplot
axs2.plot(val, pl2, 'b', label = 'Cos')
axs2.set_xlabel('Axis-X')
axs2.set_ylabel('Axis-Y')
axs2.legend()
# for adjusting the space between subplots
plt.tight_layout()
# to display the plots
plt.show()
Output

Example 2
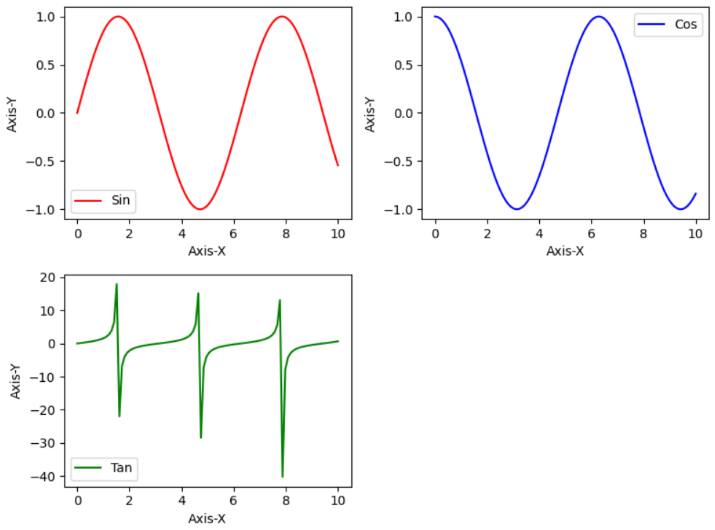
In the following example, we will change the code of previous example to add one more plot of tan functions.
import matplotlib.pyplot as plt
import numpy as np
# generating some random data for plotting
val = np.linspace(0, 10, 100)
pl1 = np.sin(val)
pl2 = np.cos(val)
pl3 = np.tan(val)
# Creating the subplots using above data
fig, axs = plt.subplots(2, 2, figsize = (8, 6))
# Plotting of the first subplot
axs[0, 0].plot(val, pl1, 'r', label = 'Sin')
axs[0, 0].set_xlabel('Axis-X')
axs[0, 0].set_ylabel('Axis-Y')
axs[0, 0].legend()
# To plot on the second subplot
axs[0, 1].plot(val, pl2, 'b', label = 'Cos')
axs[0, 1].set_xlabel('Axis-X')
axs[0, 1].set_ylabel('Axis-Y')
axs[0, 1].legend()
# Plotting of the third subplot
axs[1, 0].plot(val, pl3, 'g', label = 'Tan')
axs[1, 0].set_xlabel('Axis-X')
axs[1, 0].set_ylabel('Axis-Y')
axs[1, 0].legend()
# To remove the empty subplot
fig.delaxes(axs[1, 1])
# for adjusting the space between subplots
plt.tight_layout()
# Displaying all plots
plt.show()
Output

Conclusion
We started this article by introducing Matplotlib and its built-in method 'subplots()'. In the next section, we explained this method in detail. Also, we have discussed two example programs to show the use of the 'subplots()' method in plotting multiple plots.

