
Article Categories
- All Categories
-
 Data Structure
-
 Networking
-
 RDBMS
RDBMS
-
 Operating System
-
 Java
Java
-
 MS Excel
-
 iOS
iOS
-
 HTML
HTML
-
 CSS
CSS
-
 Android
-
 Python
-
 C Programming
-
 C++
C++
-
 C#
C#
-
 MongoDB
-
 MySQL
MySQL
-
 Javascript
-
 PHP
PHP
-
 Economics & Finance
How to perform Fourier Analysis using Data Analysis tab in Excel?
When working with large datasets spread across multiple ranges and sheets, it becomes crucial to compute Fourier Analysis manually. It is essential to swiftly compute the discrete function and evaluate the Fourier transform quickly when working with enormous datasets dispersed across several ranges which is possible only through the Data Analysis tab. Analysts can spot patterns, trends, anomalies, and outcomes by using statistical methods presented in the Data Analysis Toolpak. In this article, we will learn how to compute the Fourier Analysis using the Data Analysis tab.
To Conduct the Fourier Analysis Using the Data Analysis Tab in Excel
Step 1
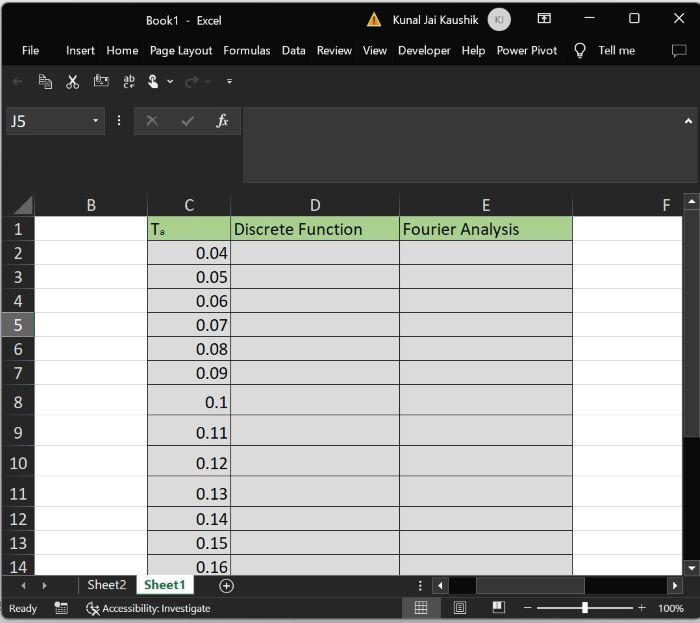
Users need to open a new worksheet and enter the following entries in the given table. The first column represents the time. Note that the number of entries in the table should be multiple of 2. Here, the total count of data value is 16 excluding the column heading.
Step 2
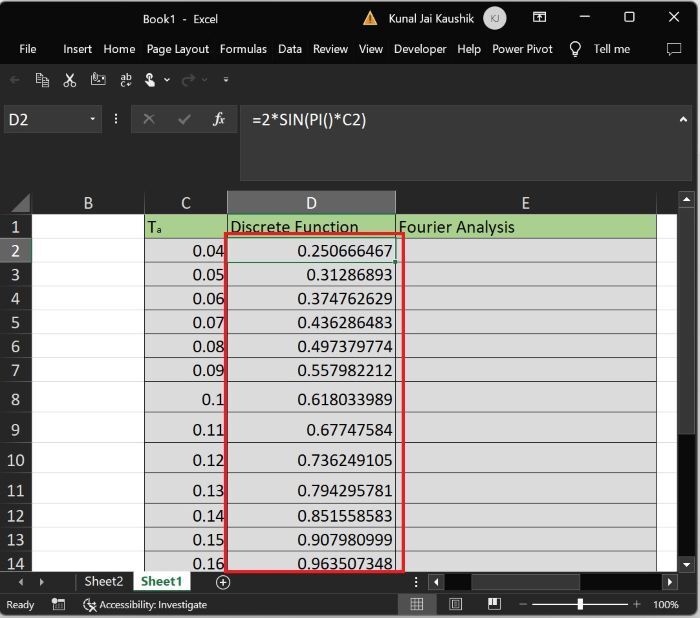
Enter the formula "=2*SIN(PI()*C2)" in the "D2" cell to calculate the Discrete function and then press the "Enter" tab to obtain the result.


Step 3
Drag "+" sign at the end of the bottom right corner of the "D2" cell and drop it to the "D17" to obtain the computed value of the remaining cells.
Step 4
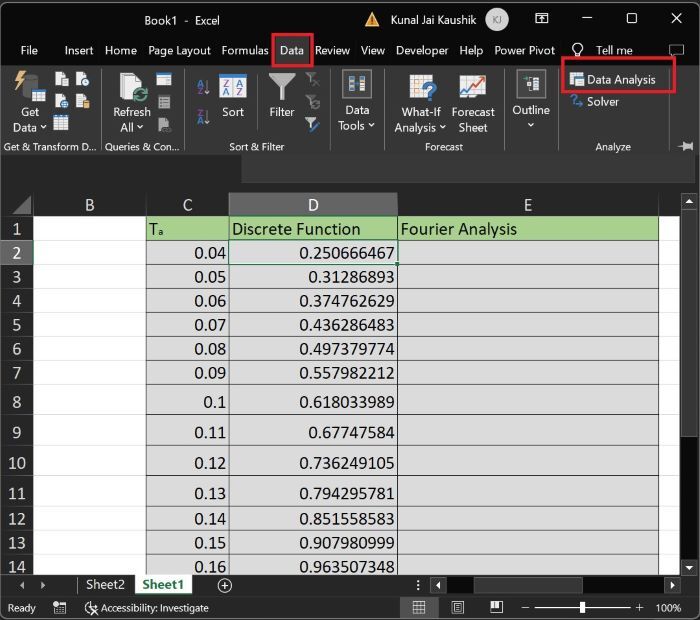
Switch to the "Data" tab and click on the "Data Analysis" option as highlighted below image
Step 5
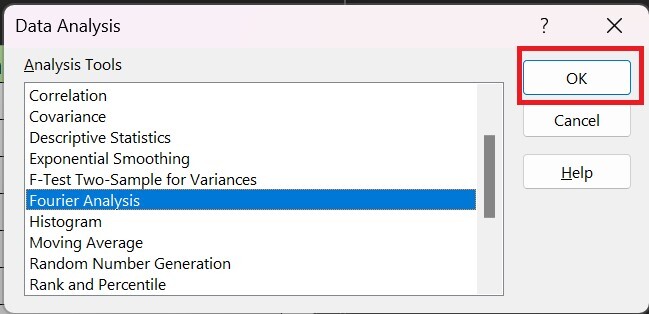
Another dialog box named "Data Analysis" will appear. Choose the "Fourier Analysis" option from the drop-down list and then click on the "OK" button.
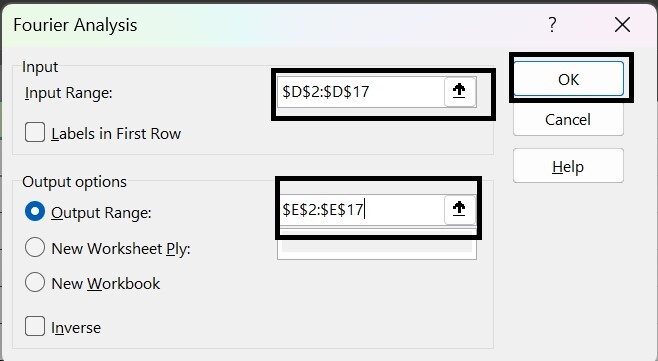
Step 6
Now, enter the range of input values in the Input section. Users may choose any of the options among the three options given in the Output options section. Here, we choose the Output Range: option and enter the specified range where output values are generated. After that, click on the OK button.
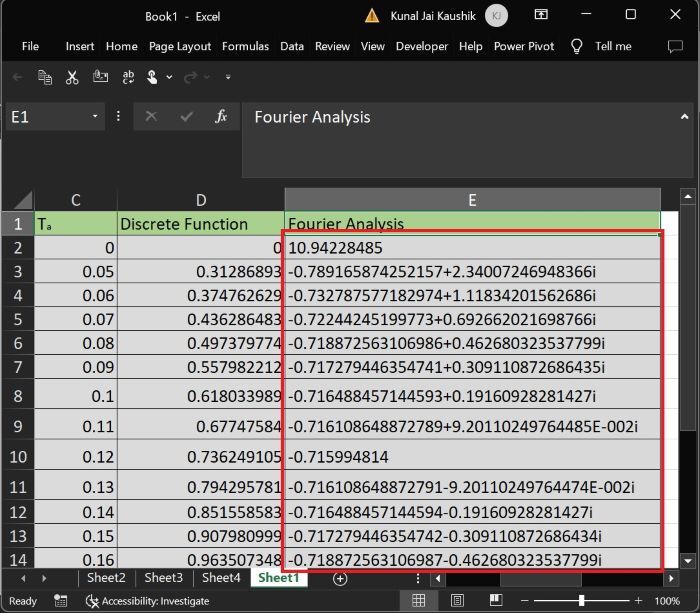
Step 7
Therefore, the result is displayed in the E column.
Conclusion
By following these creative methods, the user may save their time and generate accurate results. Comprehensive analysis can also be done by creating a scatter chart by selecting these points. Users need to install the Data Analysis toolpak before performing the Fourier Analysis in Excel.

3K+ Views
